As Europe and the United States are experiencing a second or third wave of the pandemic, depending on how you count, the debate about lockdowns is raging again. Many people are convinced they are the best way to deal with the pandemic until a vaccine arrives. Back in the Spring, I argued in favor of lockdowns because we didn’t know much about the virus and Western governments were caught by surprise (I’m not even sure I was right anymore, even when you don’t look at things in retrospect with the information we now have, but that’s a question for another day), but now I think we should not resort to them anymore. The main reason is that, after looking at the data we have accumulated in the past few months, I have come to believe that lockdowns weren’t as effective as most people think relative to less stringent restrictions. People seem to believe that lockdowns are the only kind of policy that can prevent a colossal loss of life, because less stringent restrictions just don’t cut transmission enough. They also say a lot of things about lockdowns, especially about their effects on the economy, which I think are false, but in this post I want to focus on the claim that only lockdowns are really effective to cut transmission and ultimately prevent a lot of people from dying.
Whenever someone makes that claim, you can be certain they will cite the paper Flaxman et al. published in Nature a few months ago, which concluded that non-pharmaceutical interventions had saved more than 3 millions lives in Europe in the Spring and that among those interventions only lockdowns had a substantial effect. This paper went viral when it was published and continues to be cited all the time as proof that lockdowns saved countless lives during the first wave. This isn’t just true in informal discussions, but also in the scientific literature, where this paper is systematically cited to support the claim that lockdowns are very effective. (It’s already been cited almost 450 times since it was published a few months ago.) I hadn’t read it until very recently, but since the debate about lockdown has been rekindled by the second wave in Europe, I decided to read it and I was astonished by how bad it was. Since it still plays a very important role in that debate, I think it’s important to explain why it’s bad, so in this post I’m going to take it apart and explain why even Flaxman et al.’s own analysis shows that, while lockdowns do make a difference, they don’t cut transmission that much more than other, less stringent and therefore less costly restrictions. (I basically taught myself Stan over a weekend to do this, so someone should probably check my code, though I’m pretty sure there are no major mistakes.) After pointing out that it changes the policy debate quite a lot, I conclude with a few remarks about the role bad science has played in this debate and how this paper illustrates why the cult of science that many people have fallen into is bad.
What Flaxman et al. did
I’ve seen many people claim that Flaxman et al.’s paper showed that lockdowns were very effective, but I don’t think many of them know what they actually did in that paper, because it showed no such thing despite what the authors claim. In fact, what they did is assume that non-pharmaceutical interventions work (as we shall see, the model was bound to find that lockdowns specifically did most of the work, but more on that later), fit the data on deaths to a model that makes this assumption in order to infer various epidemiological variables of interest such as 
Here is the equation they use to model the true number of infections: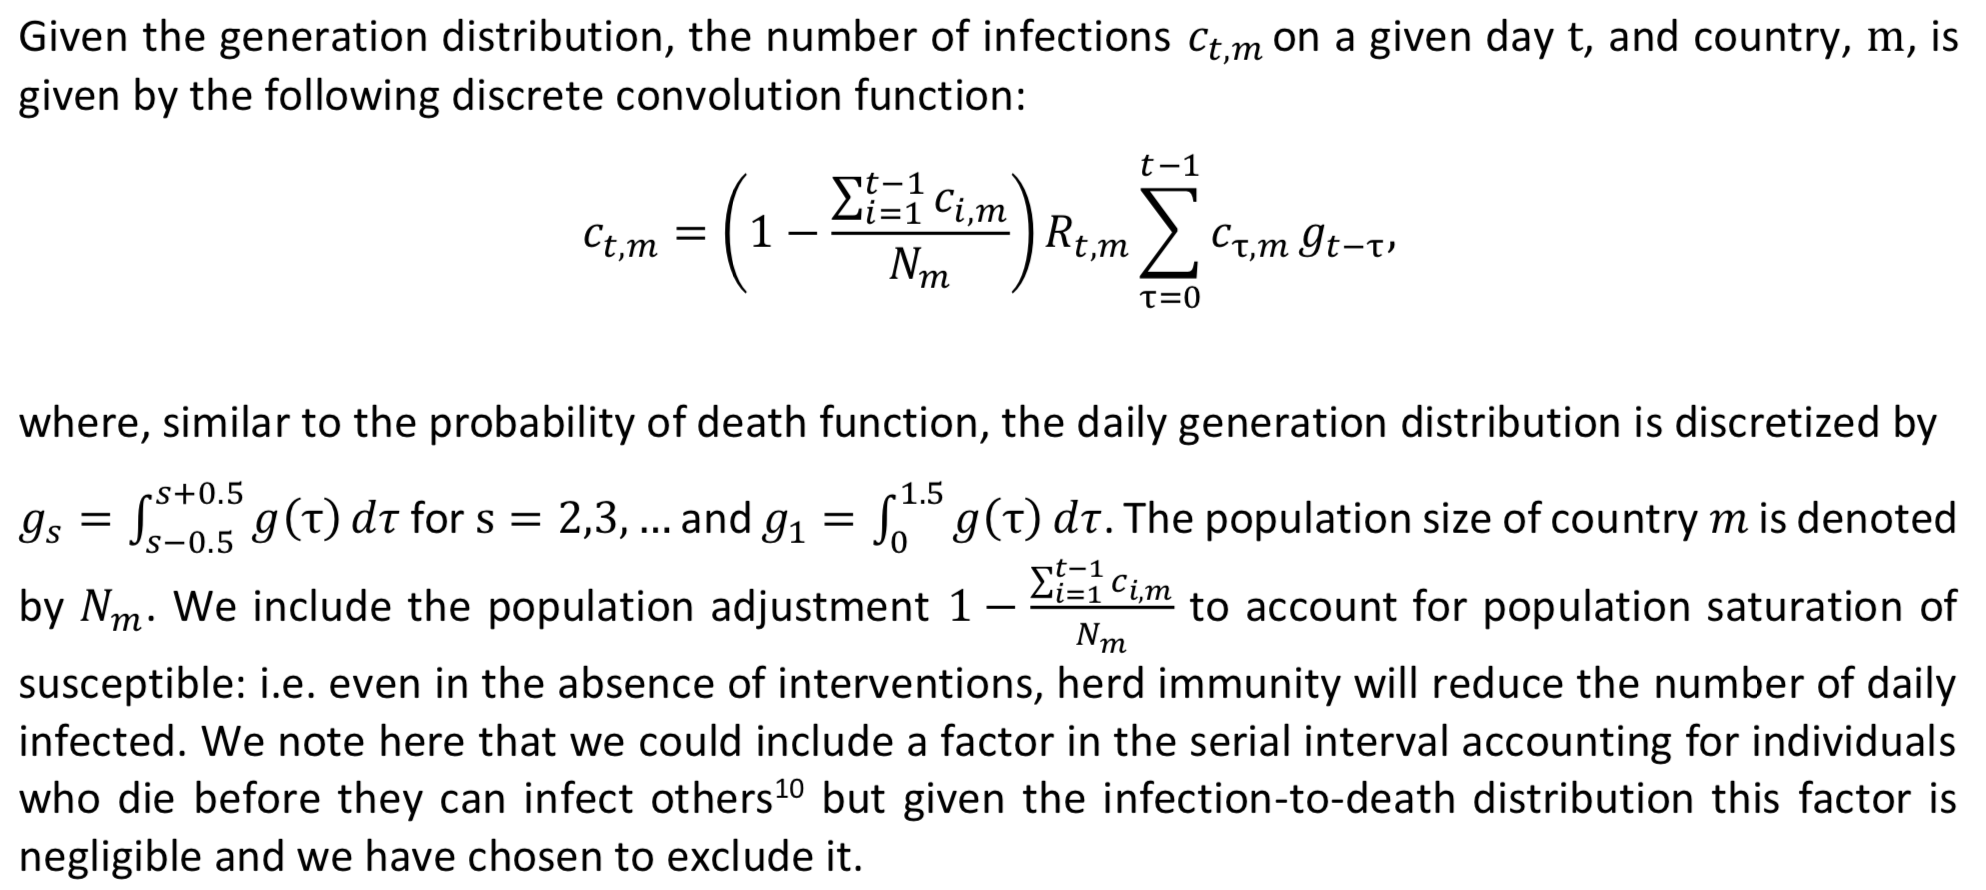 It’s basically a discrete version of the SIR model, the most basic model of epidemiology. Don’t worry if mathematical symbols scare you, what it says is just that, on any given day, the number of people who get infected depends on the number of people who got infected previously and are still infectious, when they were infected, as well as on the reproduction number
Lockdowns and other non-pharmaceutical interventions affect the number of infections through their effect on 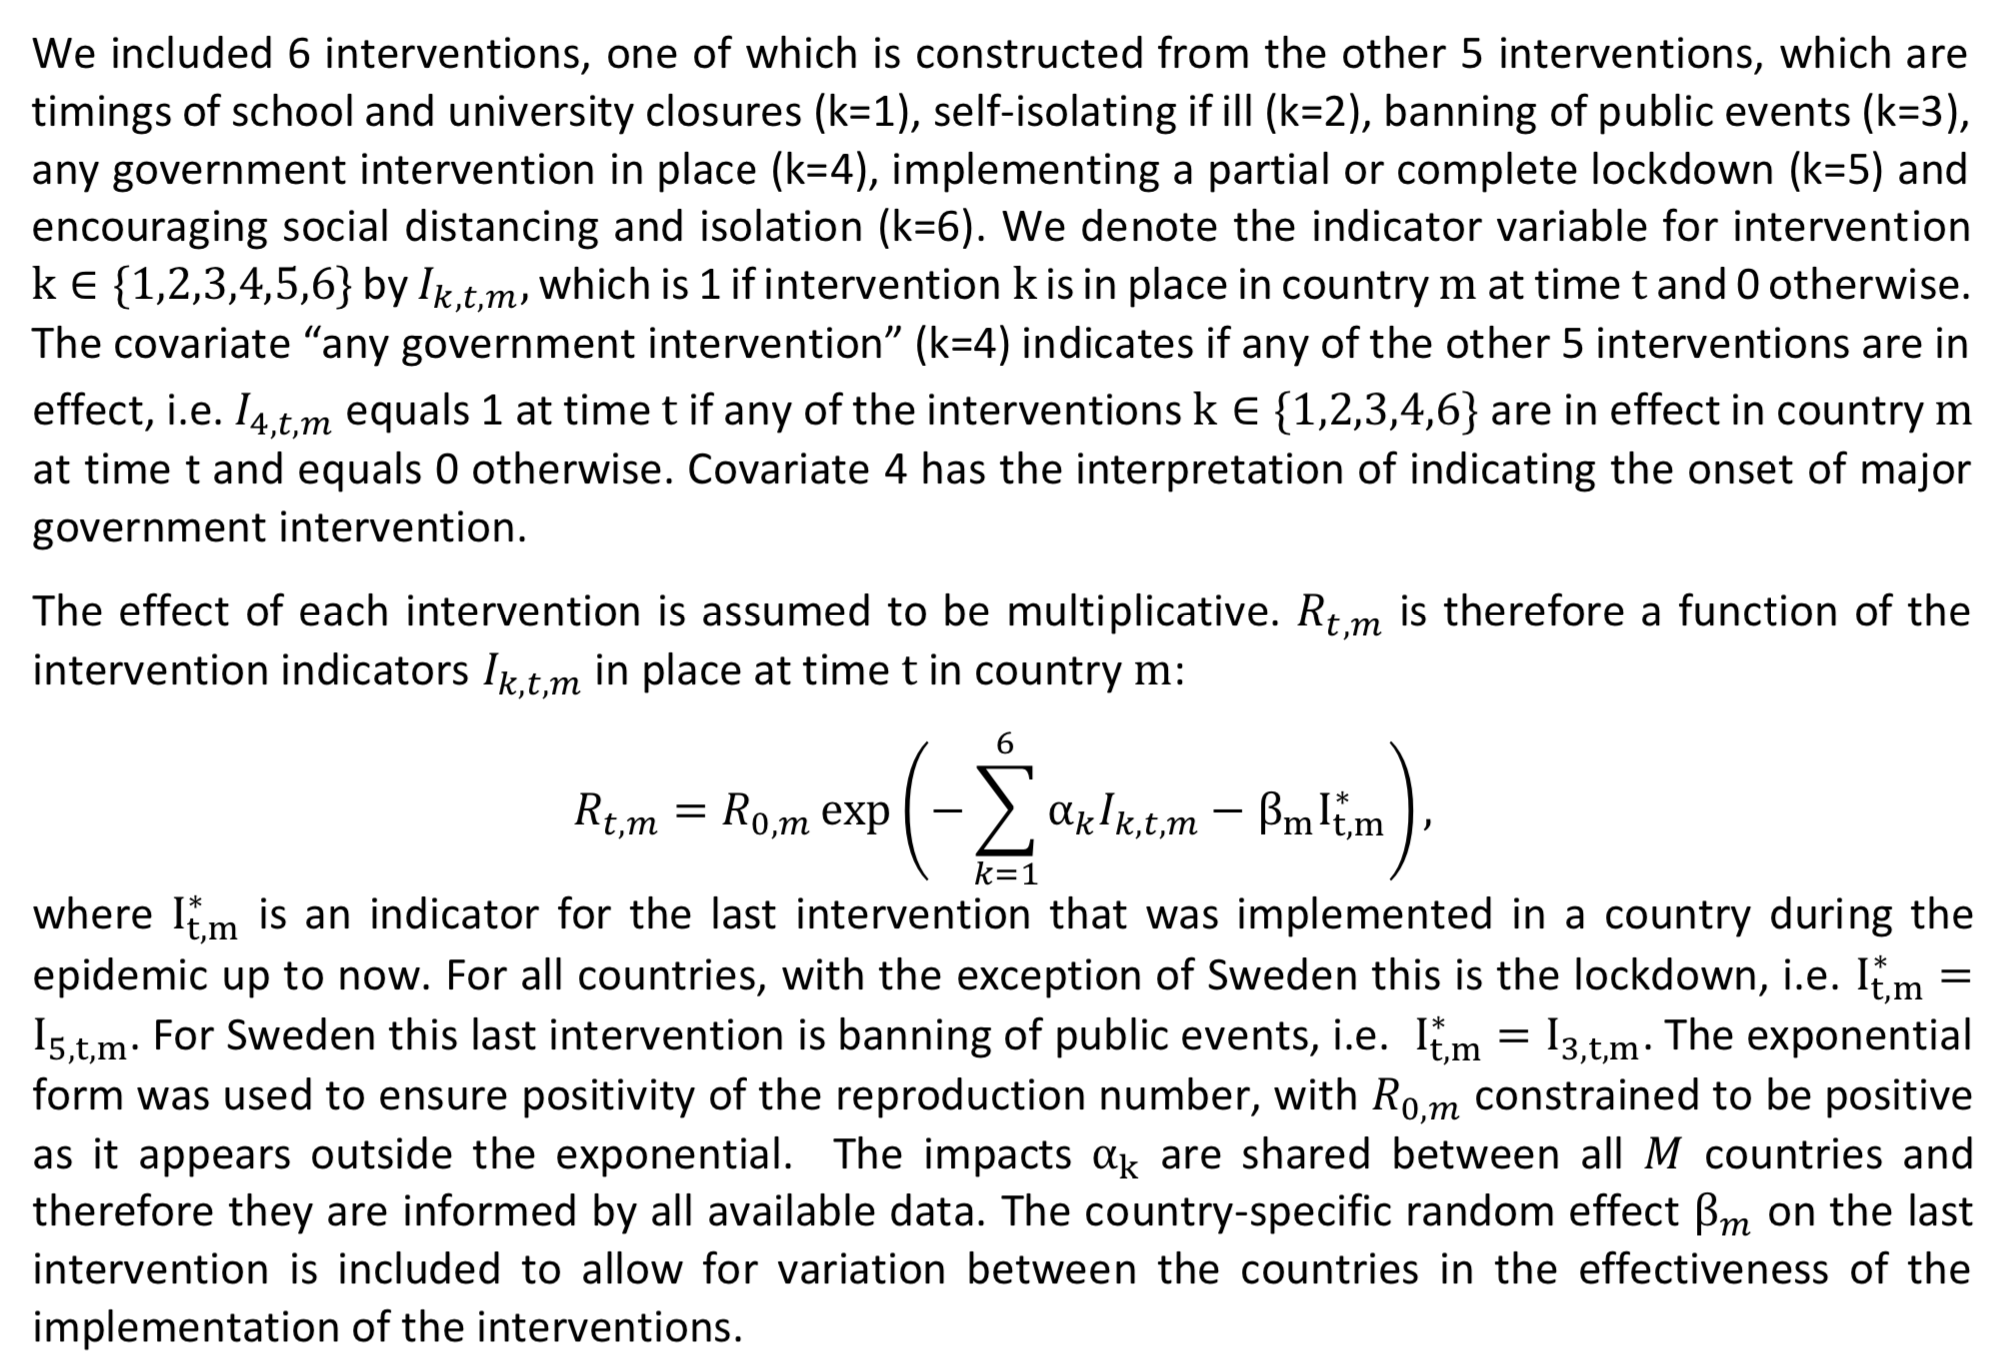 Again, it’s not a big deal if you don’t understand everything, what you need to remember is that each non-pharmaceutical intervention is assumed to affect
Many people have criticized the first assumption, but while it’s no doubt unrealistic, the second and third assumptions seem even worse. Indeed, it’s obvious that even in the absence of any government interventions, people would still change their behavior in response to the pandemic because they’re afraid. This would reduce transmission and therefore it’s not true that only non-pharmaceutical interventions affect
Not only very different interventions are treated as the same in the model, but even if they had really been identical, their effect in different countries would still have been different for idiosyncratic reasons. Everybody has noted how people in some cultures might be more willing to follow rules, but there are many other possible factors that could also affect how effective the same intervention would be in different countries, such as differences in the proportion of people who need to take public transportation to go to work, differences in the age distribution of the population, etc. As you can see above, Flaxman et al. did include a country-specific effect in the model, which is supposed to model the fact that, precisely for this kind of idiosyncratic reasons, we don’t expect that even the same non-pharmaceutical interventions will be equally effective in every country. I will come back to this country-specific effect later, because it plays a very important and largely unacknowledged role in Flaxman et al.’s paper, but for the moment it’s enough to say that it’s only associated with the last intervention, which is a lockdown in every country except in Sweden where it’s the ban of public events. So the model only acknowledges that idiosyncratic factors could affect how effective the same interventions are in different countries for lockdowns but not for the other interventions.
Another problem with the model is that it assumes the population of each country is homogenous, which is undoubtedly false and might result in getting the dynamic of the epidemic wrong even in the early phase, though as I have discussed before we don’t really know. (Some people seem to think that, since I wrote this, various things have shown that the naive model was correct, but they are confused. However, there is only so much you can talk about in one post, so perhaps I will revisit that issue some other time.) I just mention that issue because I think it’s important and people should try to model heterogeneity more often, if only as a robustness check, but I won’t be focusing on that in the rest of this post because we don’t know how much it matters and, even if heterogeneity actually had a large effect on the dynamic of the epidemic and the final attack rate, I think not modeling it would mostly affect their counterfactual and not their estimates of the effect of non-pharmaceutical interventions.
Finally, they don’t fit their model on data about cases, but instead assume a particular infection fatality rate for each country and use this plus the infection-to-death distribution 


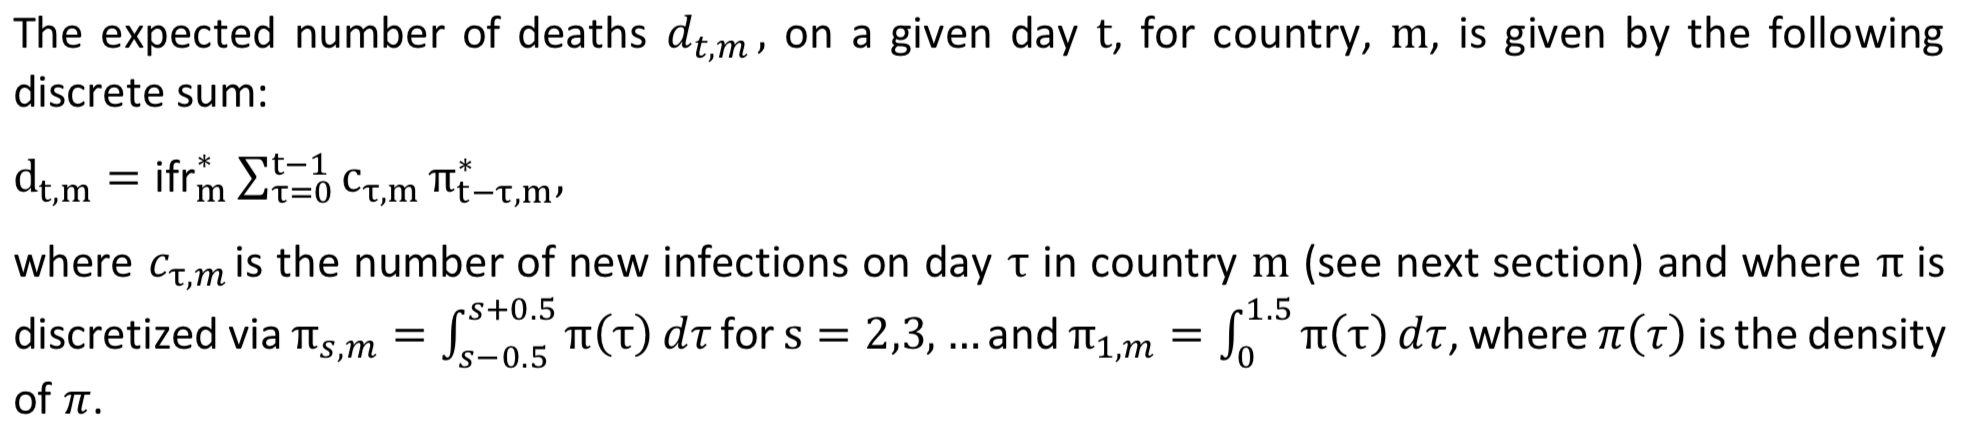 Again, don’t worry if you don’t understand everything, what’s important is just that you understand that Flaxman et al. assume a particular infection fatality rate and a distribution of the delay between infection and death (both of which are estimated from data collected early in the pandemic), which they use to infer the daily number of infections during the period they consider by working backward from the data on deaths. This is a good idea because, while data on deaths are hardly perfect, there are definitely more reliable than data on cases, which are a mess.
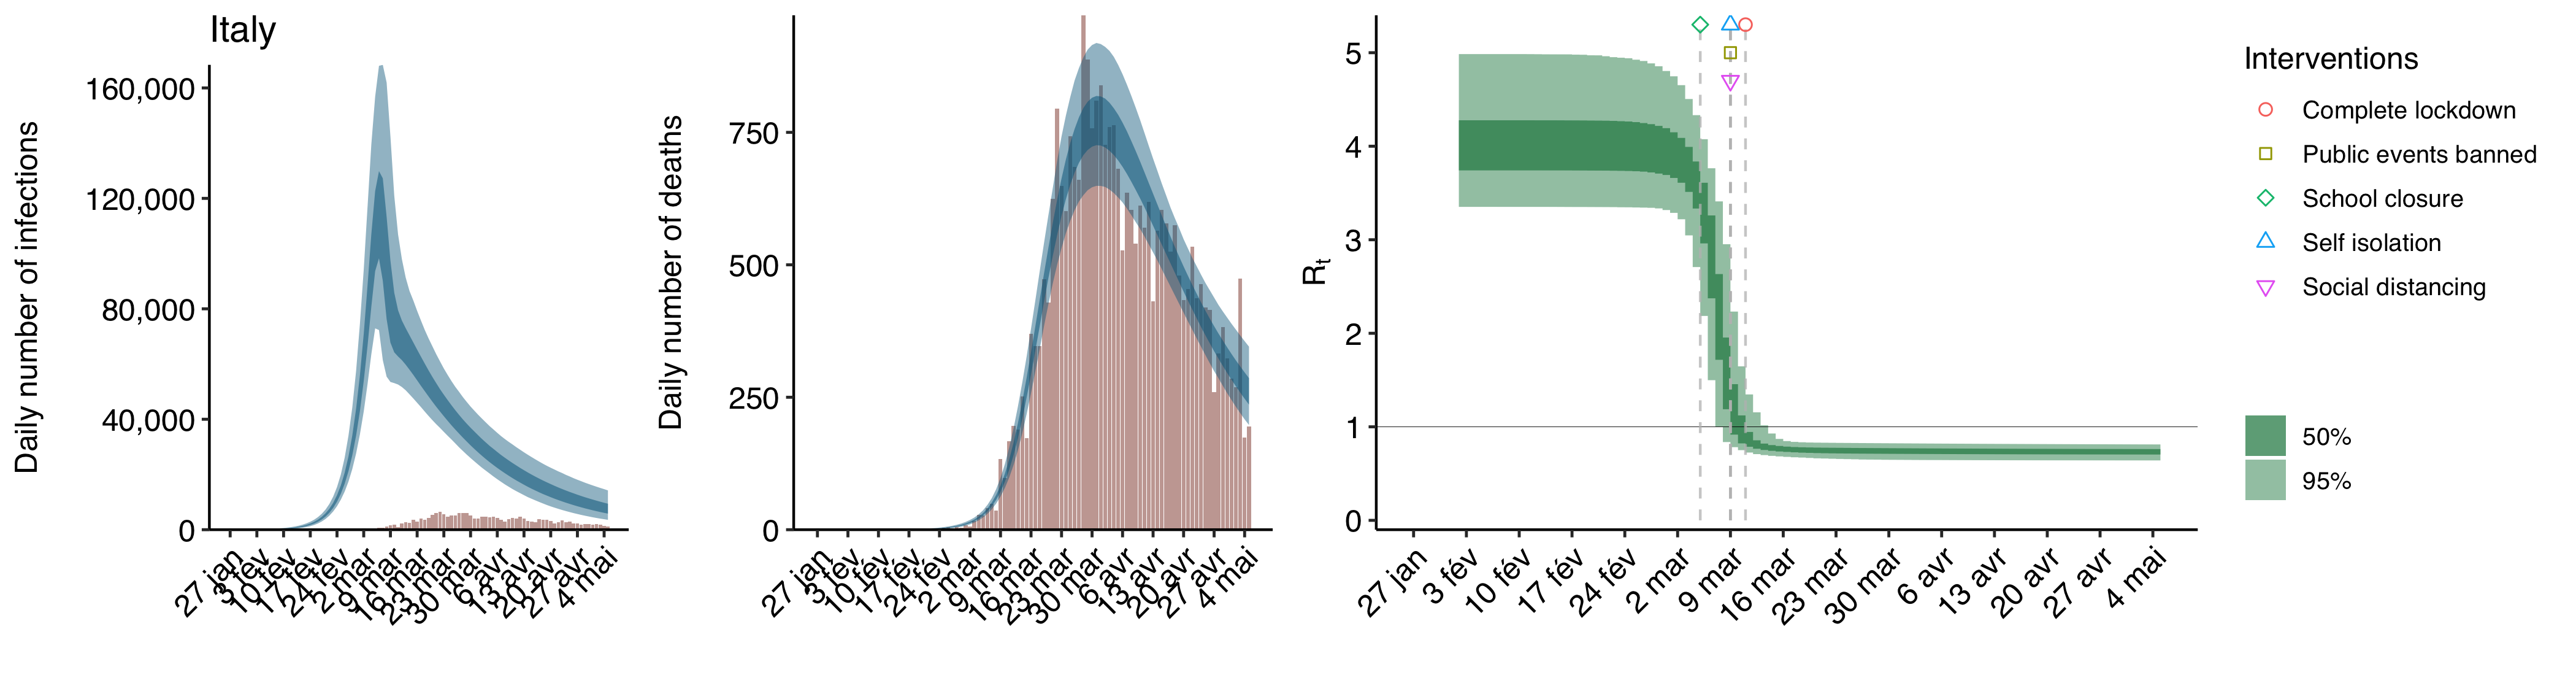
Anyway, I’ll go back to the model they used later, but you know enough about it for now, so let’s talk about their results. Here is a replication of what is arguably the most important chart Flaxman et al. put in their paper, which shows the effect of each intervention on 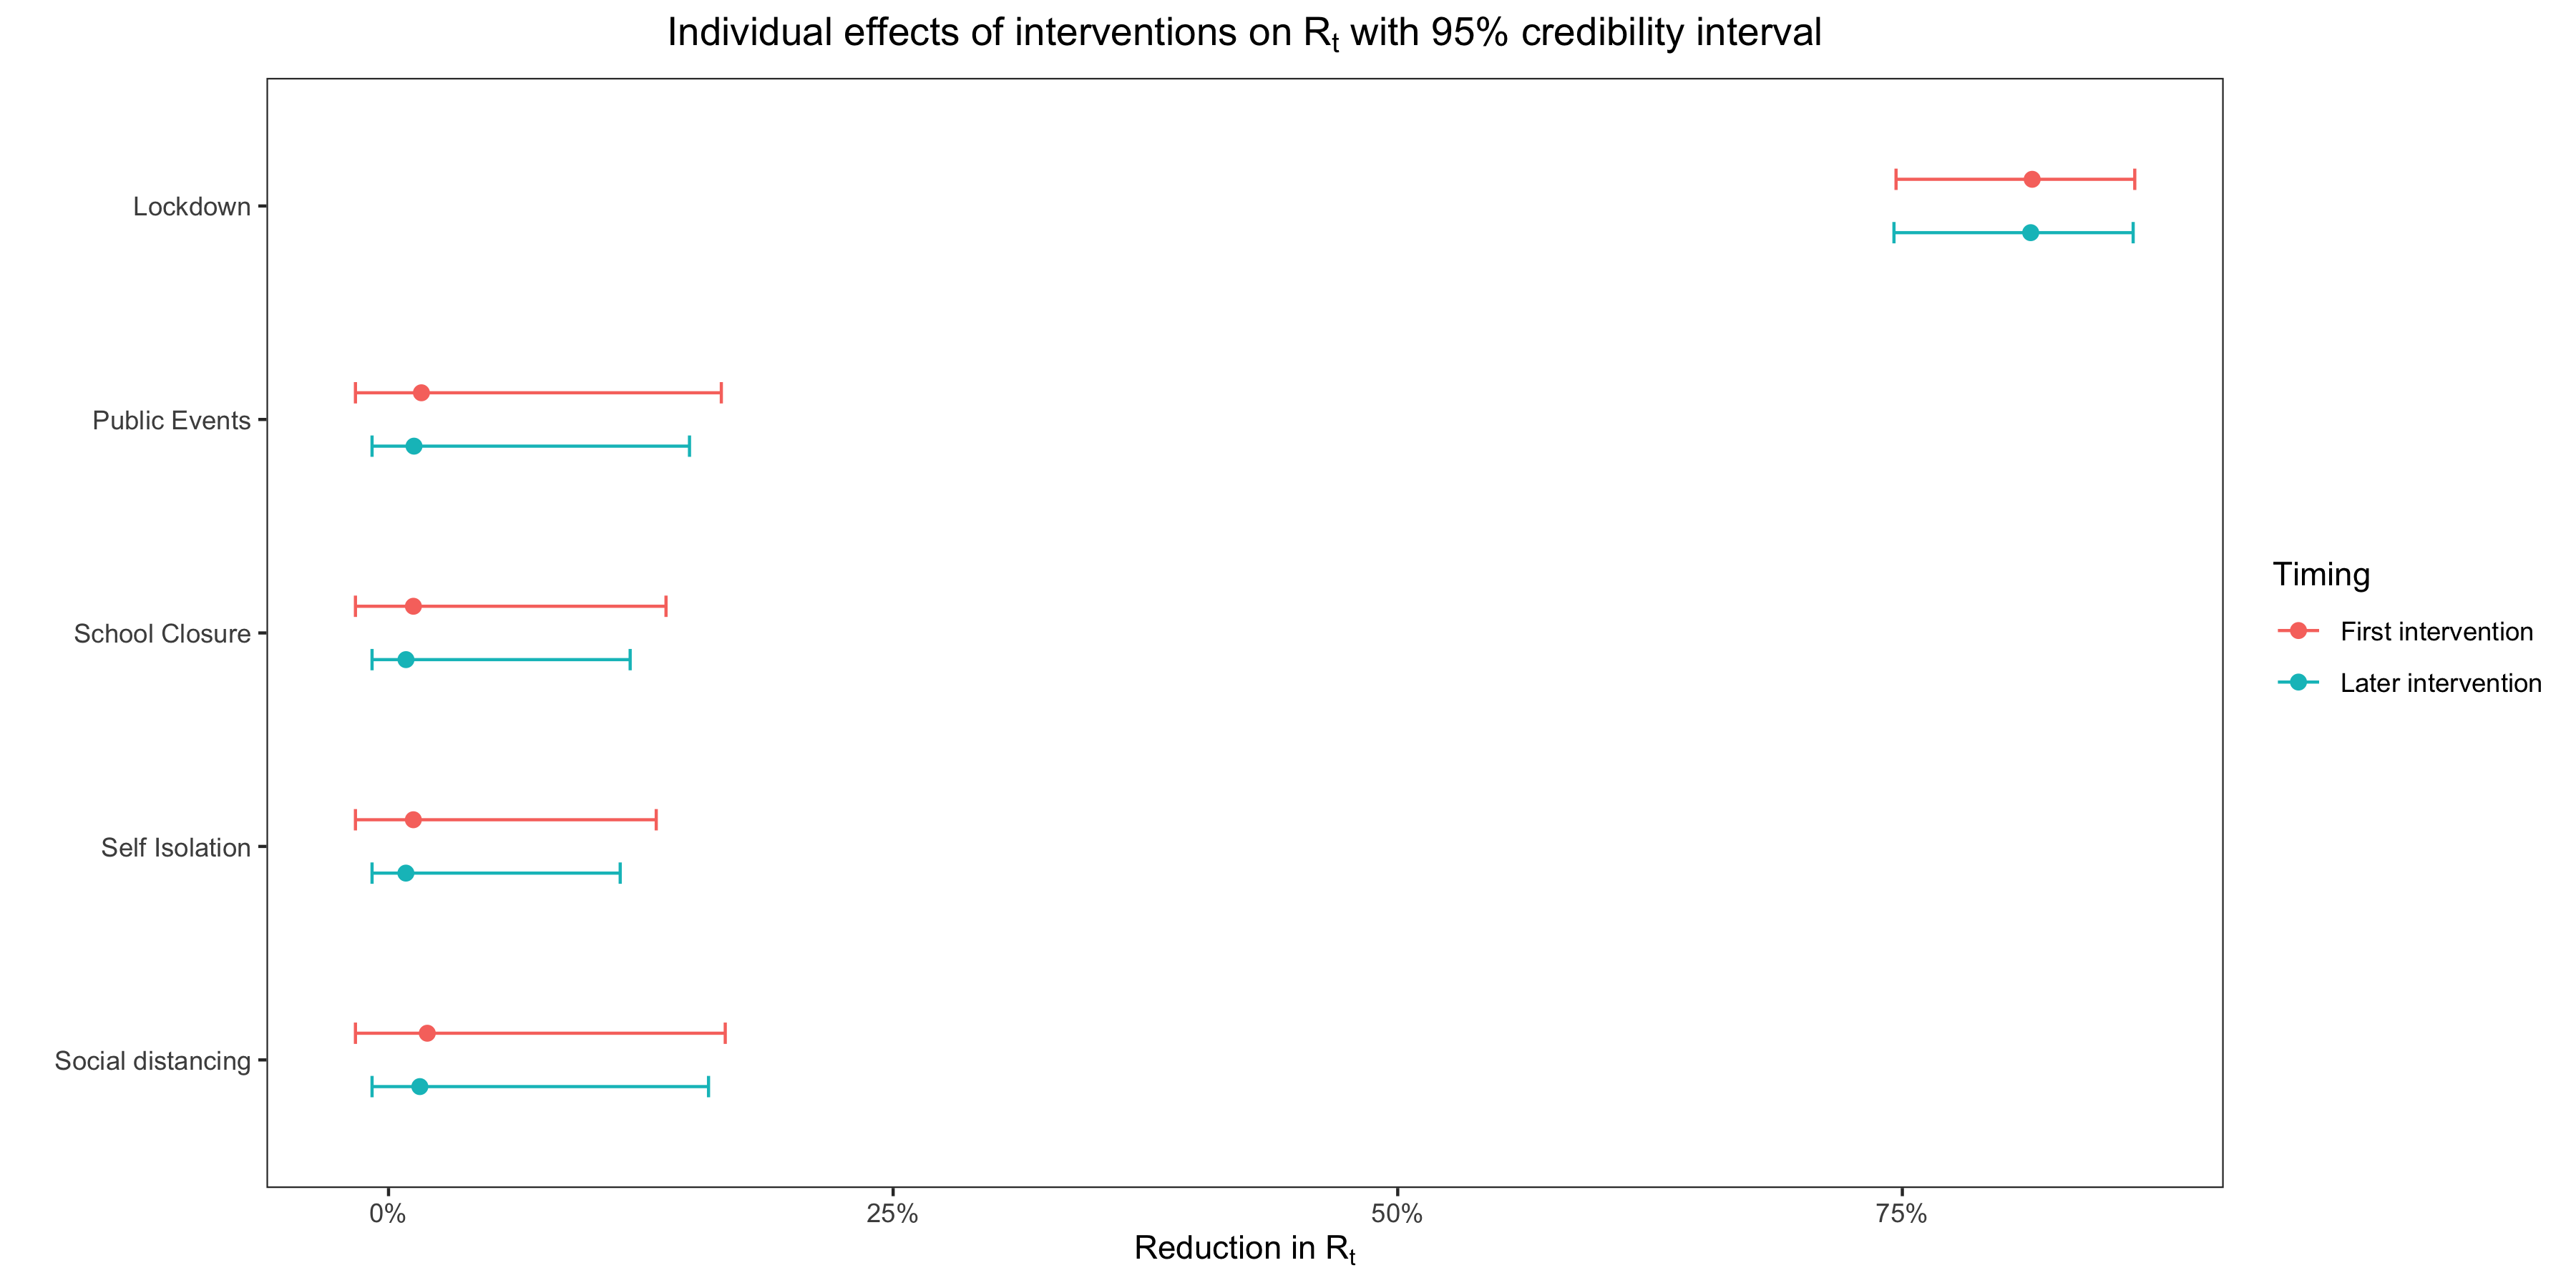 As you can see, according to their model, only lockdowns had any effect on the reproduction number, while the other interventions had no meaningful effect.
That’s the first headline, i. e. lockdowns have a huge effect on transmission and nothing else does, but what about the other, i. e. non-pharmaceutical interventions saved more than 3 million lives in Europe during the first wave? Here is the table in their paper that shows how many lives, according to their model, were saved by non-pharmaceutical interventions during the first wave for each country: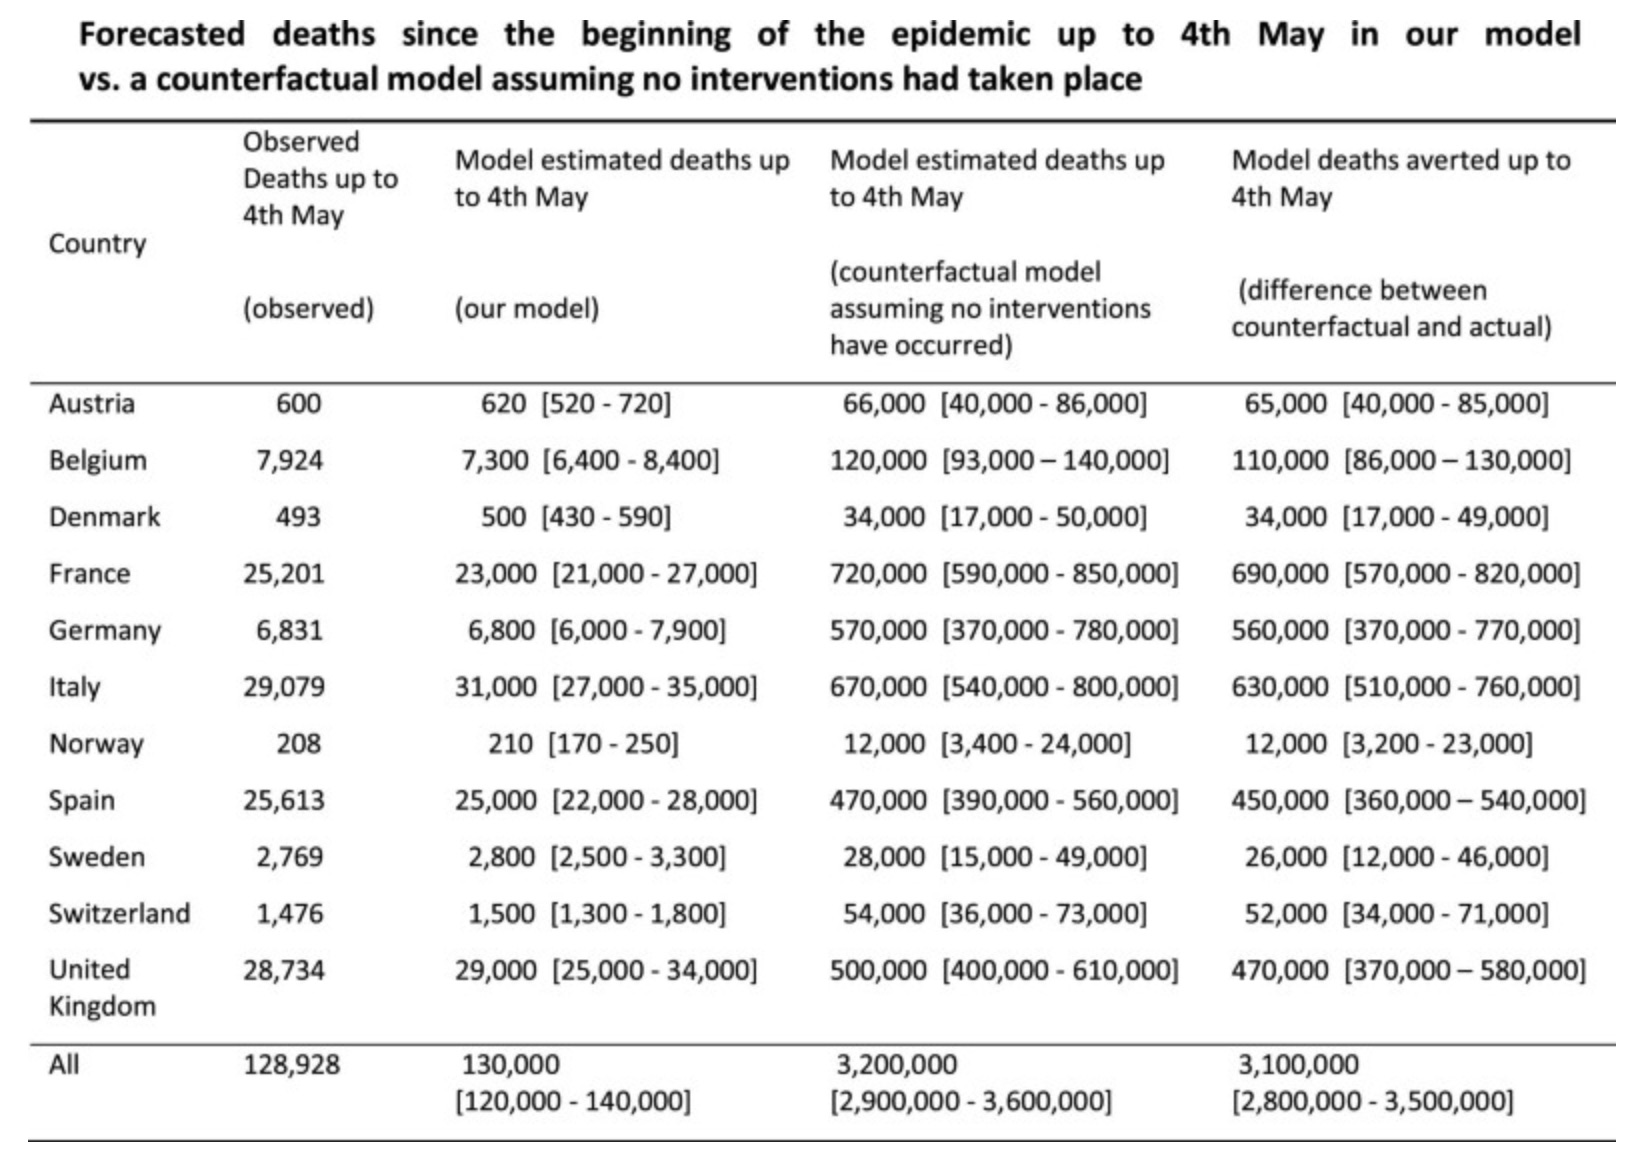 Since as we have seen, they also found that, except for lockdowns, no interventions had any meaningful effect on transmission, it follows that lockdowns are responsible for the vast majority of the more than 3 million lives saved.
In order to reach this estimate, they had to estimate the number of deaths the pandemic would have caused in a counterfactual where there were no interventions, since the number of deaths averted by restrictions is just the difference between the actual number of deaths and the number of deaths there would have been in that counterfactual. What they did to estimate how many people would have died in the absence of interventions is just take the estimates of 
Taking a closer look at the results
When I saw the table above, I immediately noticed that something didn’t make sense. As you can see in this table, the number of deaths that were averted by non-pharmaceutical interventions in Sweden according to the model is comparable to the number of deaths they averted in other countries, which suggests that Sweden’s policies to contain the epidemic were about as effective as the interventions in other countries. This is confirmed by plotting the overall effect of interventions in each country according to the model: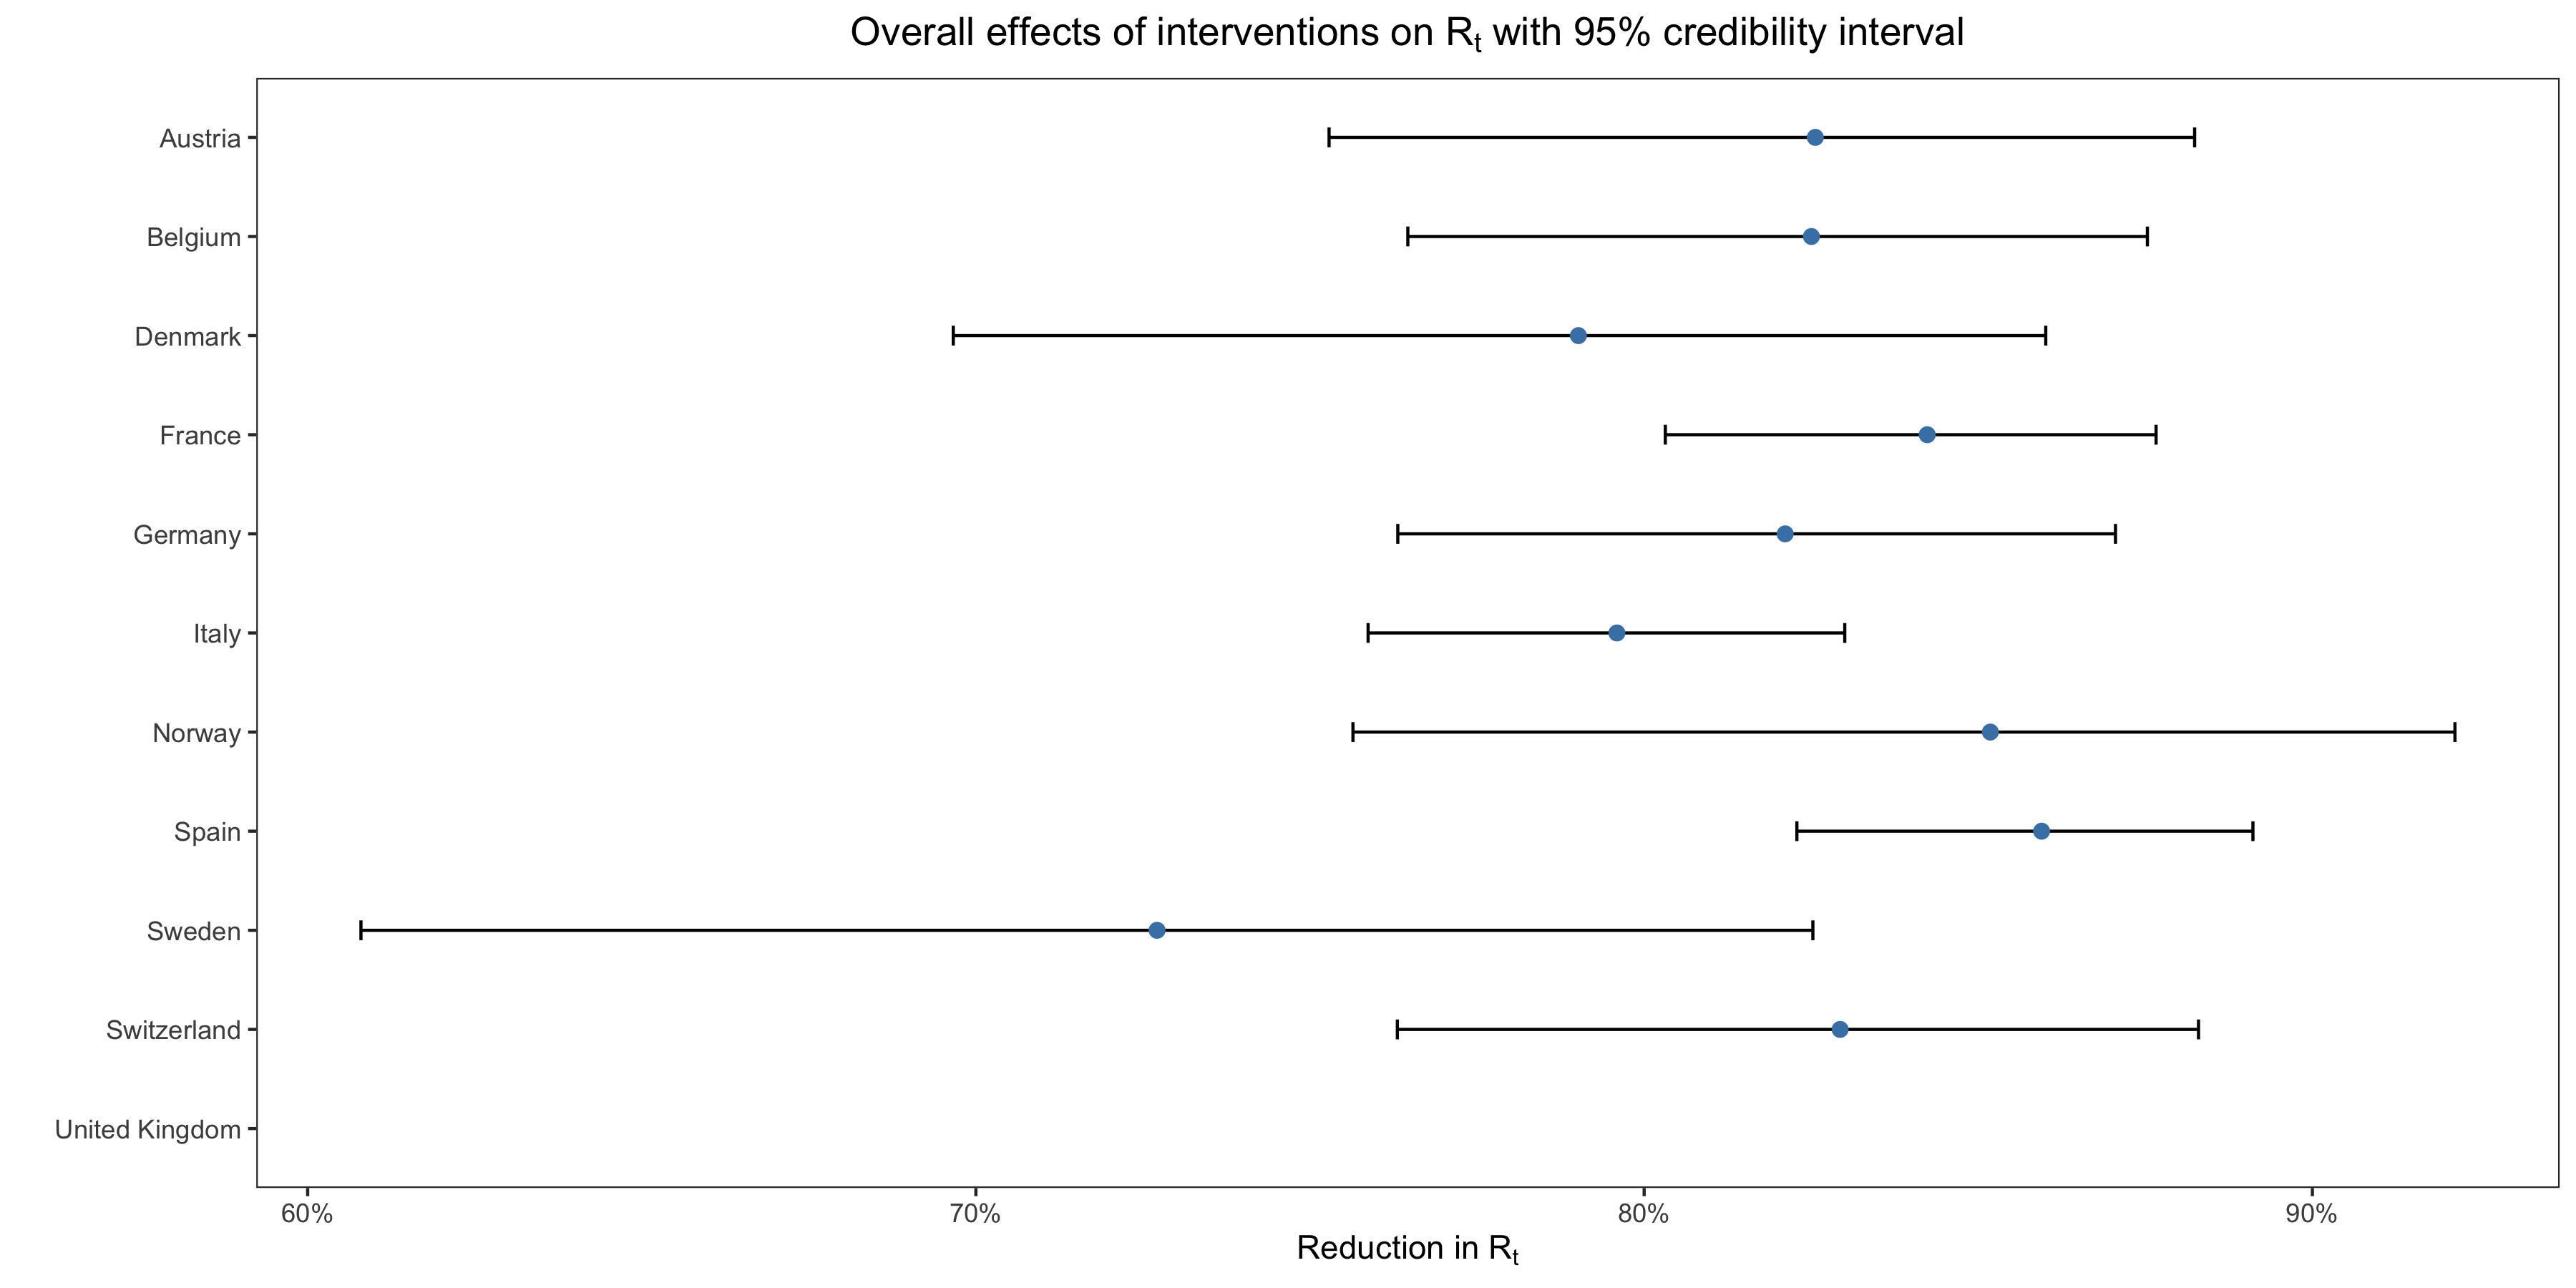 However, still according to the model, only lockdowns had a meaningful effect on transmission and Sweden didn’t have a lockdown, so this doesn’t make sense.
The only way I could think to explain this anomaly is that, for Sweden but not the other countries, the country-specific effect in the model was huge. However, as far as can tell, Flaxman et al. don’t say what the country-specific effect was for Sweden either in the paper or in the supplementary materials. This immediately triggered my bullshit detector, so I went and downloaded the code of their paper to take a closer look at the results and, lo and behold, my suspicion was confirmed. In this chart, I have plotted the country-specific effect of the last intervention in each country: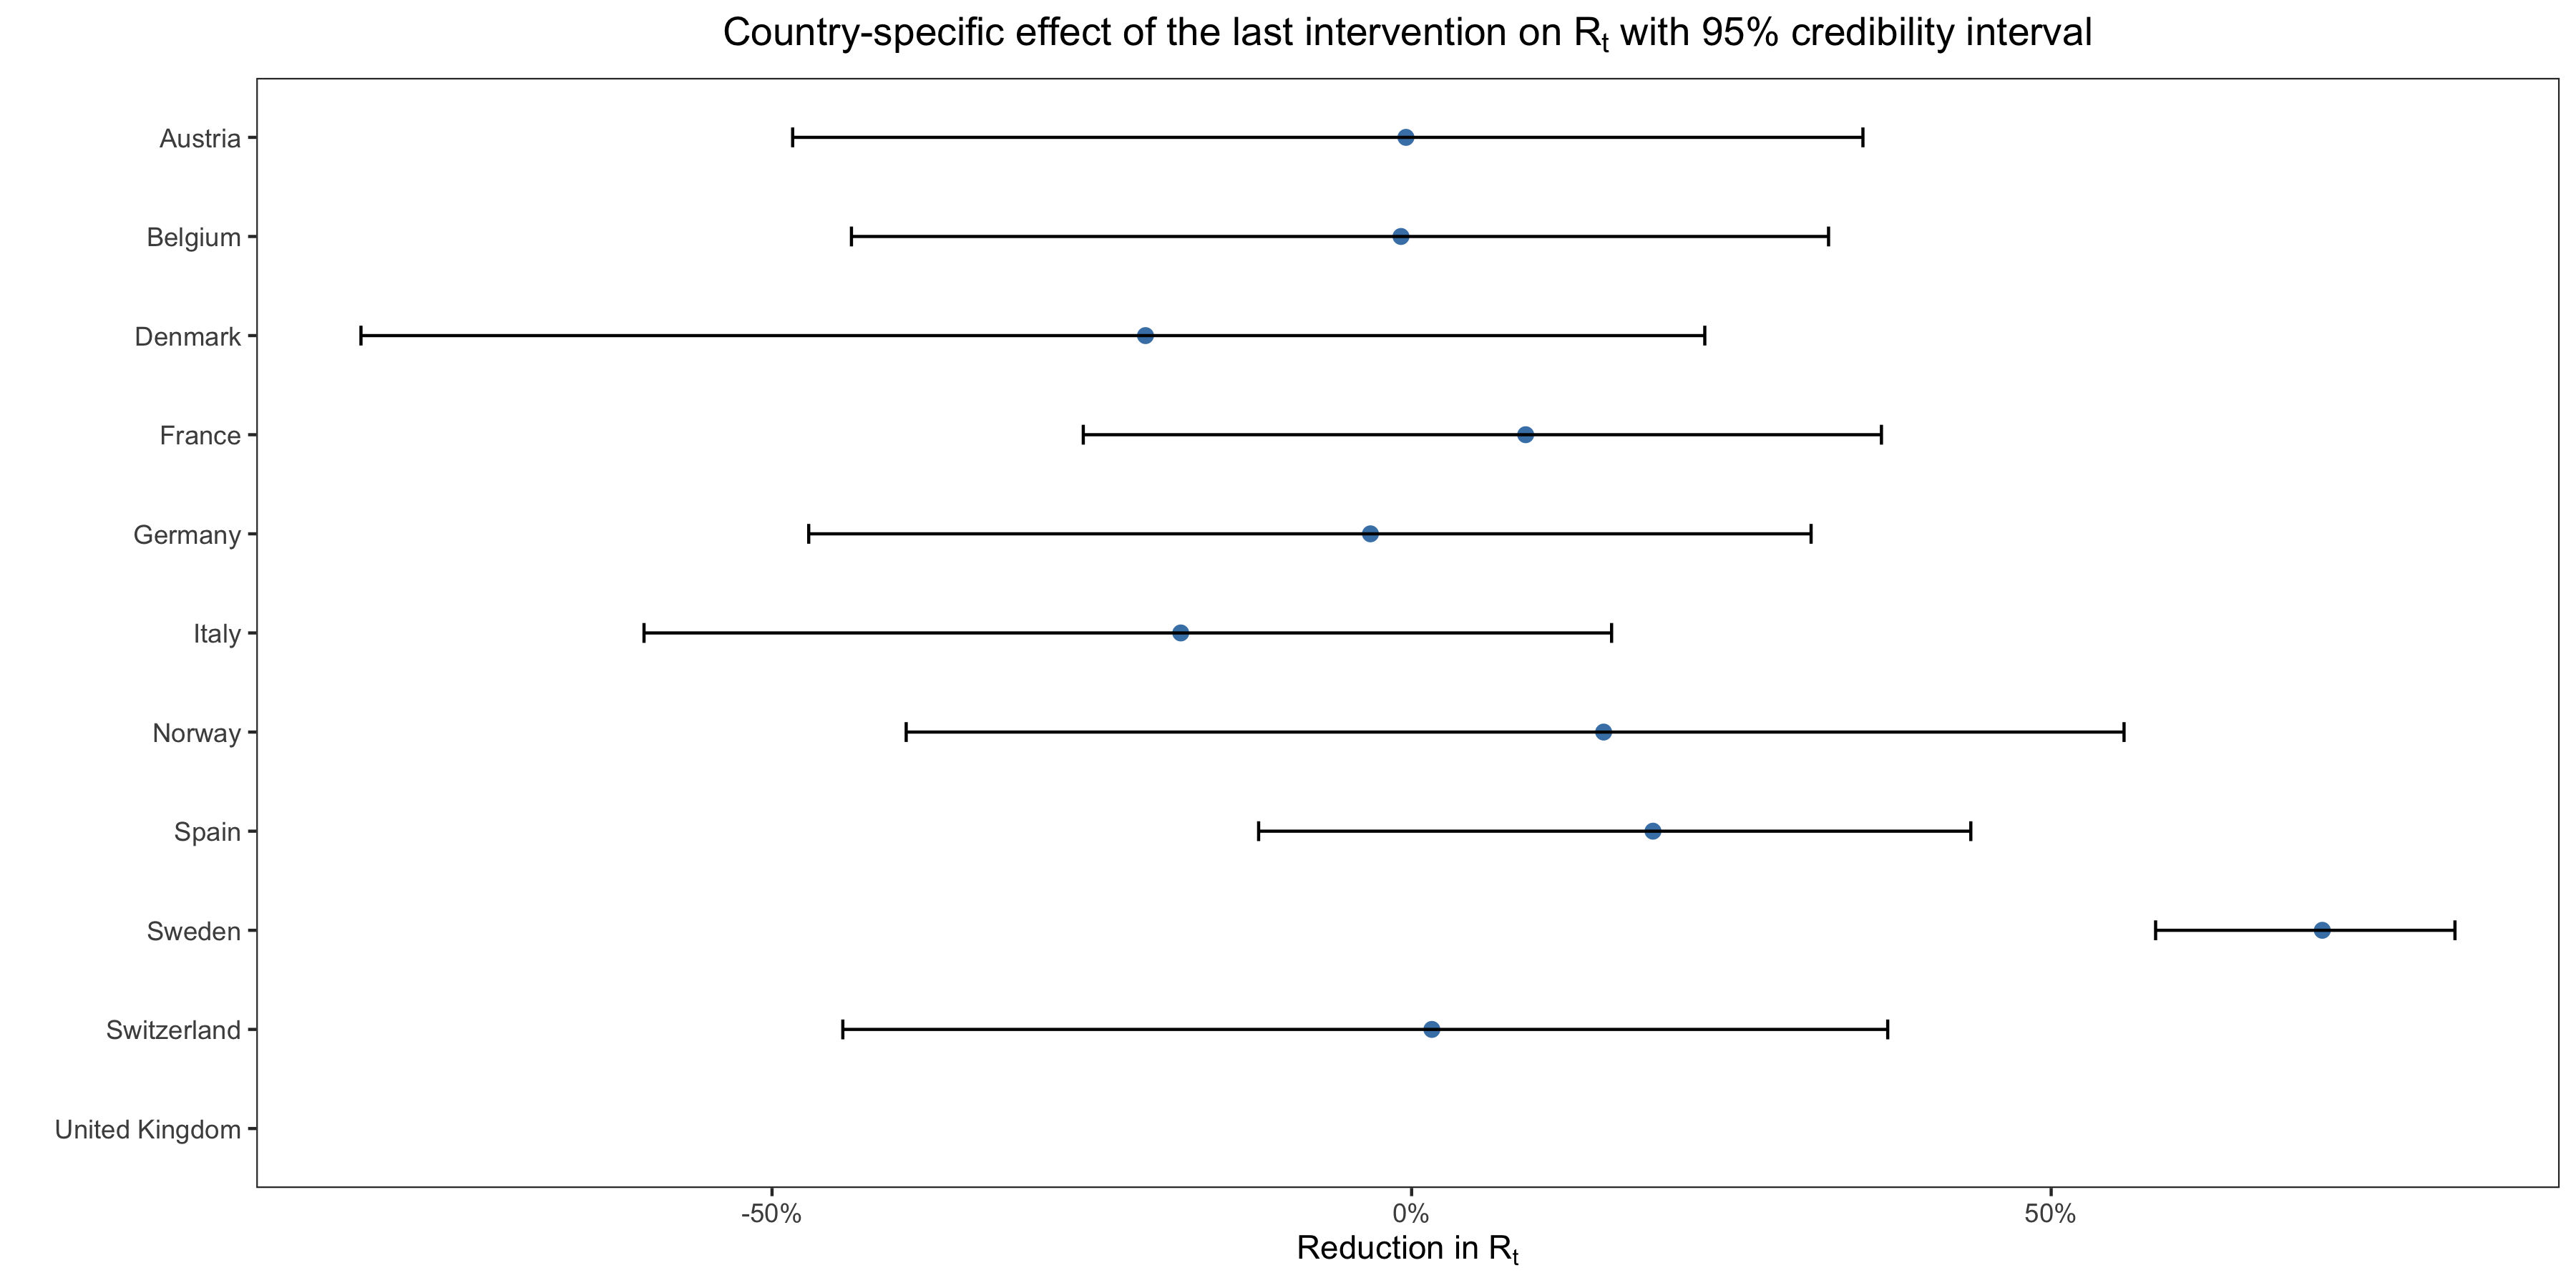 As you can see, the country-specific effect for Sweden is gigantic, barely less than what the model estimates for the effect of a complete lockdown, whereas it hovers around zero for the other countries. Indeed, according to their prior on the country-specific effect, there was only a 1 in 4,000 chance that it would be that large. Moreover, the estimate is pretty tightly estimated for Sweden, but the credible intervals are extremely wide for the other countries.
Now, this completely undermines the conclusion Flaxman et al. draw from their results, so I understand why they swept that fact under the rug and didn’t show this chart anywhere in the paper or even in the supplementary materials… (What I don’t understand, or would not understand if I didn’t know how peer review actually works, is that no reviewer asked for it.) Indeed, the country-specific effect is supposed to model how the same interventions may not be equally effective in every country for idiosyncratic reasons, but unless you believe there is some kind of magic floating in the air in Sweden, it doesn’t make sense to believe that, for some mysterious reasons, banning public events was several orders of magnitude more effective over there than in the rest of Europe, despite the fact that it only banned events with more than 500 people and was therefore less stringent than in any other country except Germany. The obvious explanation is that the model is misspecified and that in fact it’s not the case that lockdowns did most of the work in reducing transmission. Instead, most of the heavy lifting was or would have been done by other, less stringent interventions plus more or less spontaneous behavioral changes. You don’t need a complicated model to reach this conclusion, you just have to look at the death curve in Sweden during the first wave or at the epidemic curve in other countries where there was no lockdown or where it wasn’t nearly as strict as in the Spring but where
I actually think that not mentioning this fact about the country-specific effect in Sweden comes very close to scientific malpractice. It makes their main conclusion, which as just noted can be seen to be implausible without any complicated modeling, very hard to maintain and I have a hard time believing they weren’t aware of that and that it’s not why they carefully avoided the topic in describing their results. In any case, what is clear is that, once you realize that the model was only able to find that no intervention except lockdowns had a meaningful effect on transmission by estimating a huge country-specific effect for Sweden, it becomes impossible to take that conclusion seriously. As we have seen, the assumption that only non-pharmaceutical interventions affect
Why the model found that lockdowns single-handedly broke the epidemic
First, as Nicholas Lewis noted, their choice of prior for the effect of the interventions made the model far more likely to find that all but one or two interventions had almost no effect on
The first way to see this is to run the model separately on each country’s data instead of pooling as they did in the paper and look at the results for Sweden where there was no lockdown. As Flaxman et al. explain in the supplementary materials, where they show the results of this analysis for Sweden and 3 other countries, they actually tried that. As far as I can tell, they didn’t give the code for this analysis, but I was able to replicate it by adapting their code for the original, pooled model and here are the results for Sweden: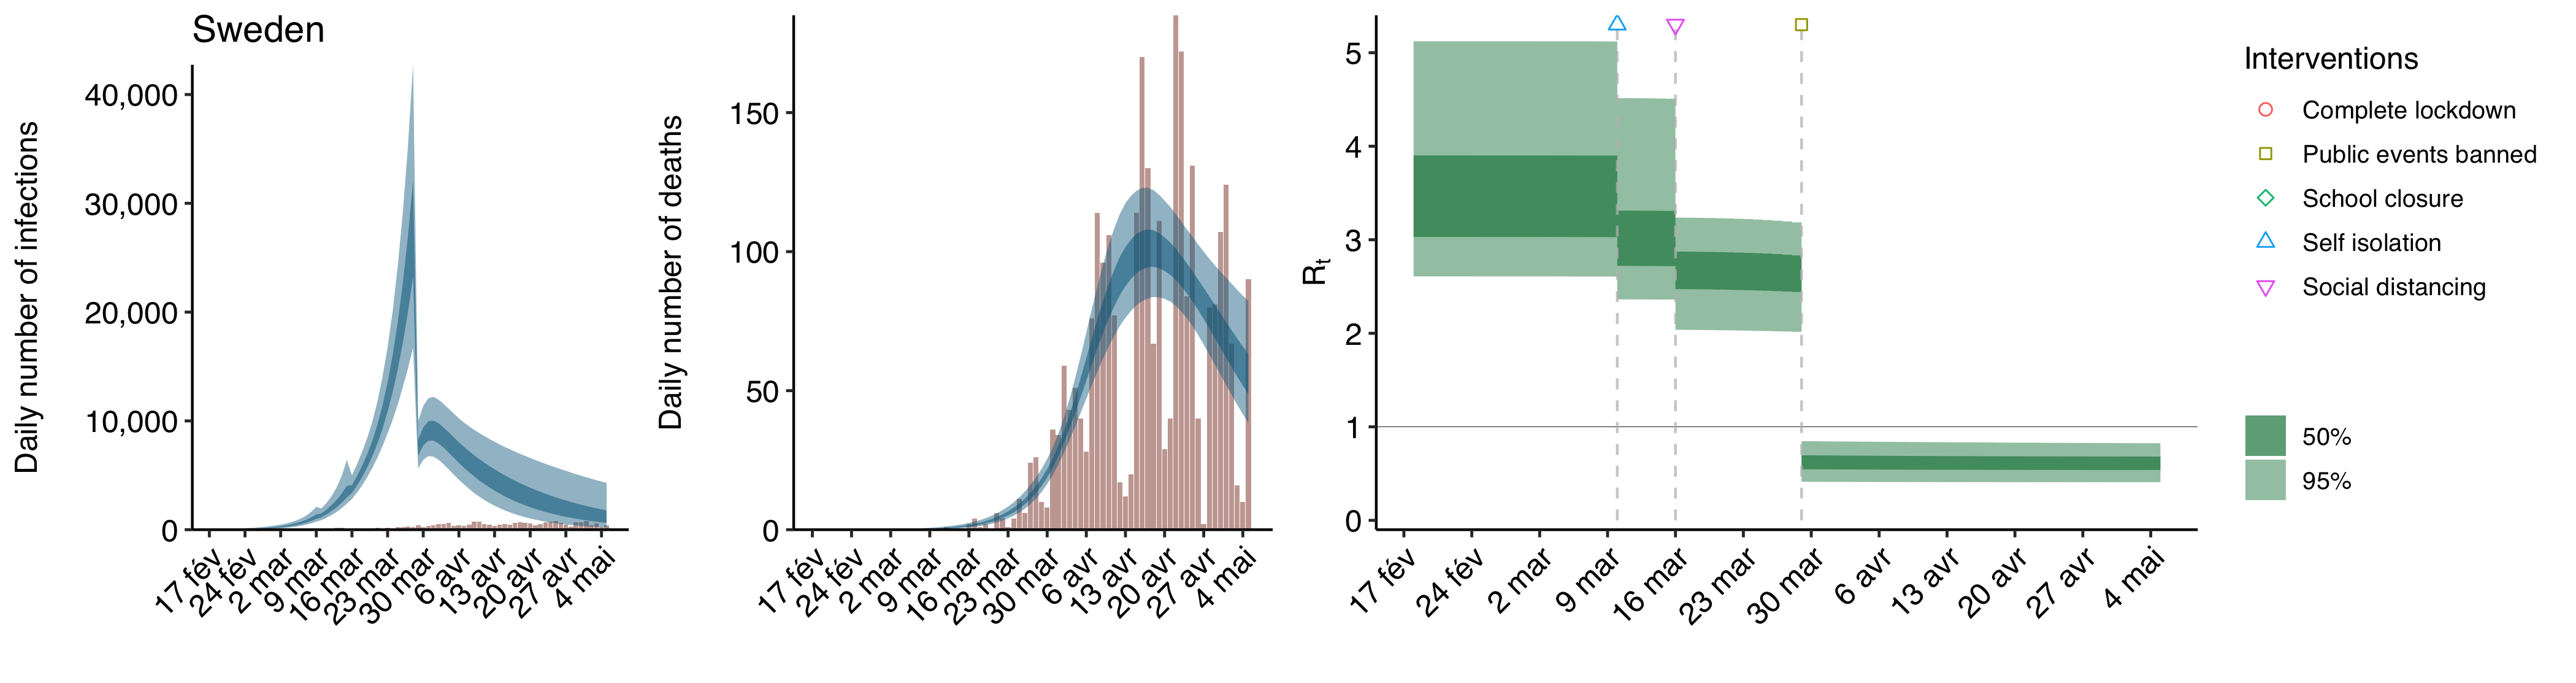 As you can see, although the last intervention isn’t a lockdown, the model still finds that it had a huge effect on
Instead, it seems they just performed this analysis to argue that pooling was justified (see supplementary discussion 8 in the supplementary materials and their response to reviewer 3), on the ground that it allows to estimate the effect of each intervention more precisely since the model can use more data that way and that running the model separately on each country doesn’t meaningfully affect their conclusions anyway. I don’t find this argument very convincing, because if you have good reasons to think that a pooled model would be seriously misspecified, which is definitely the case here, then in my opinion the fact that pooling allows you to have more data to estimate the effects of interventions precisely and be less dependent on each country’s data reporting idiosyncrasies is not really a good reason to do it since the results are not interpretable. Again, if only because non-pharmaceutical interventions actually took very different forms in different countries even when they were treated as identical in Flaxman et al.’s model, we’d expect their effects to be pretty heterogenous across countries.
Moreover, the claim that pooling didn’t significantly alter the results — Flaxman et al. say they show “considerable agreement” with the non-pooled model — seems highly disputable, since when you plot the effects it looks like this in most countries: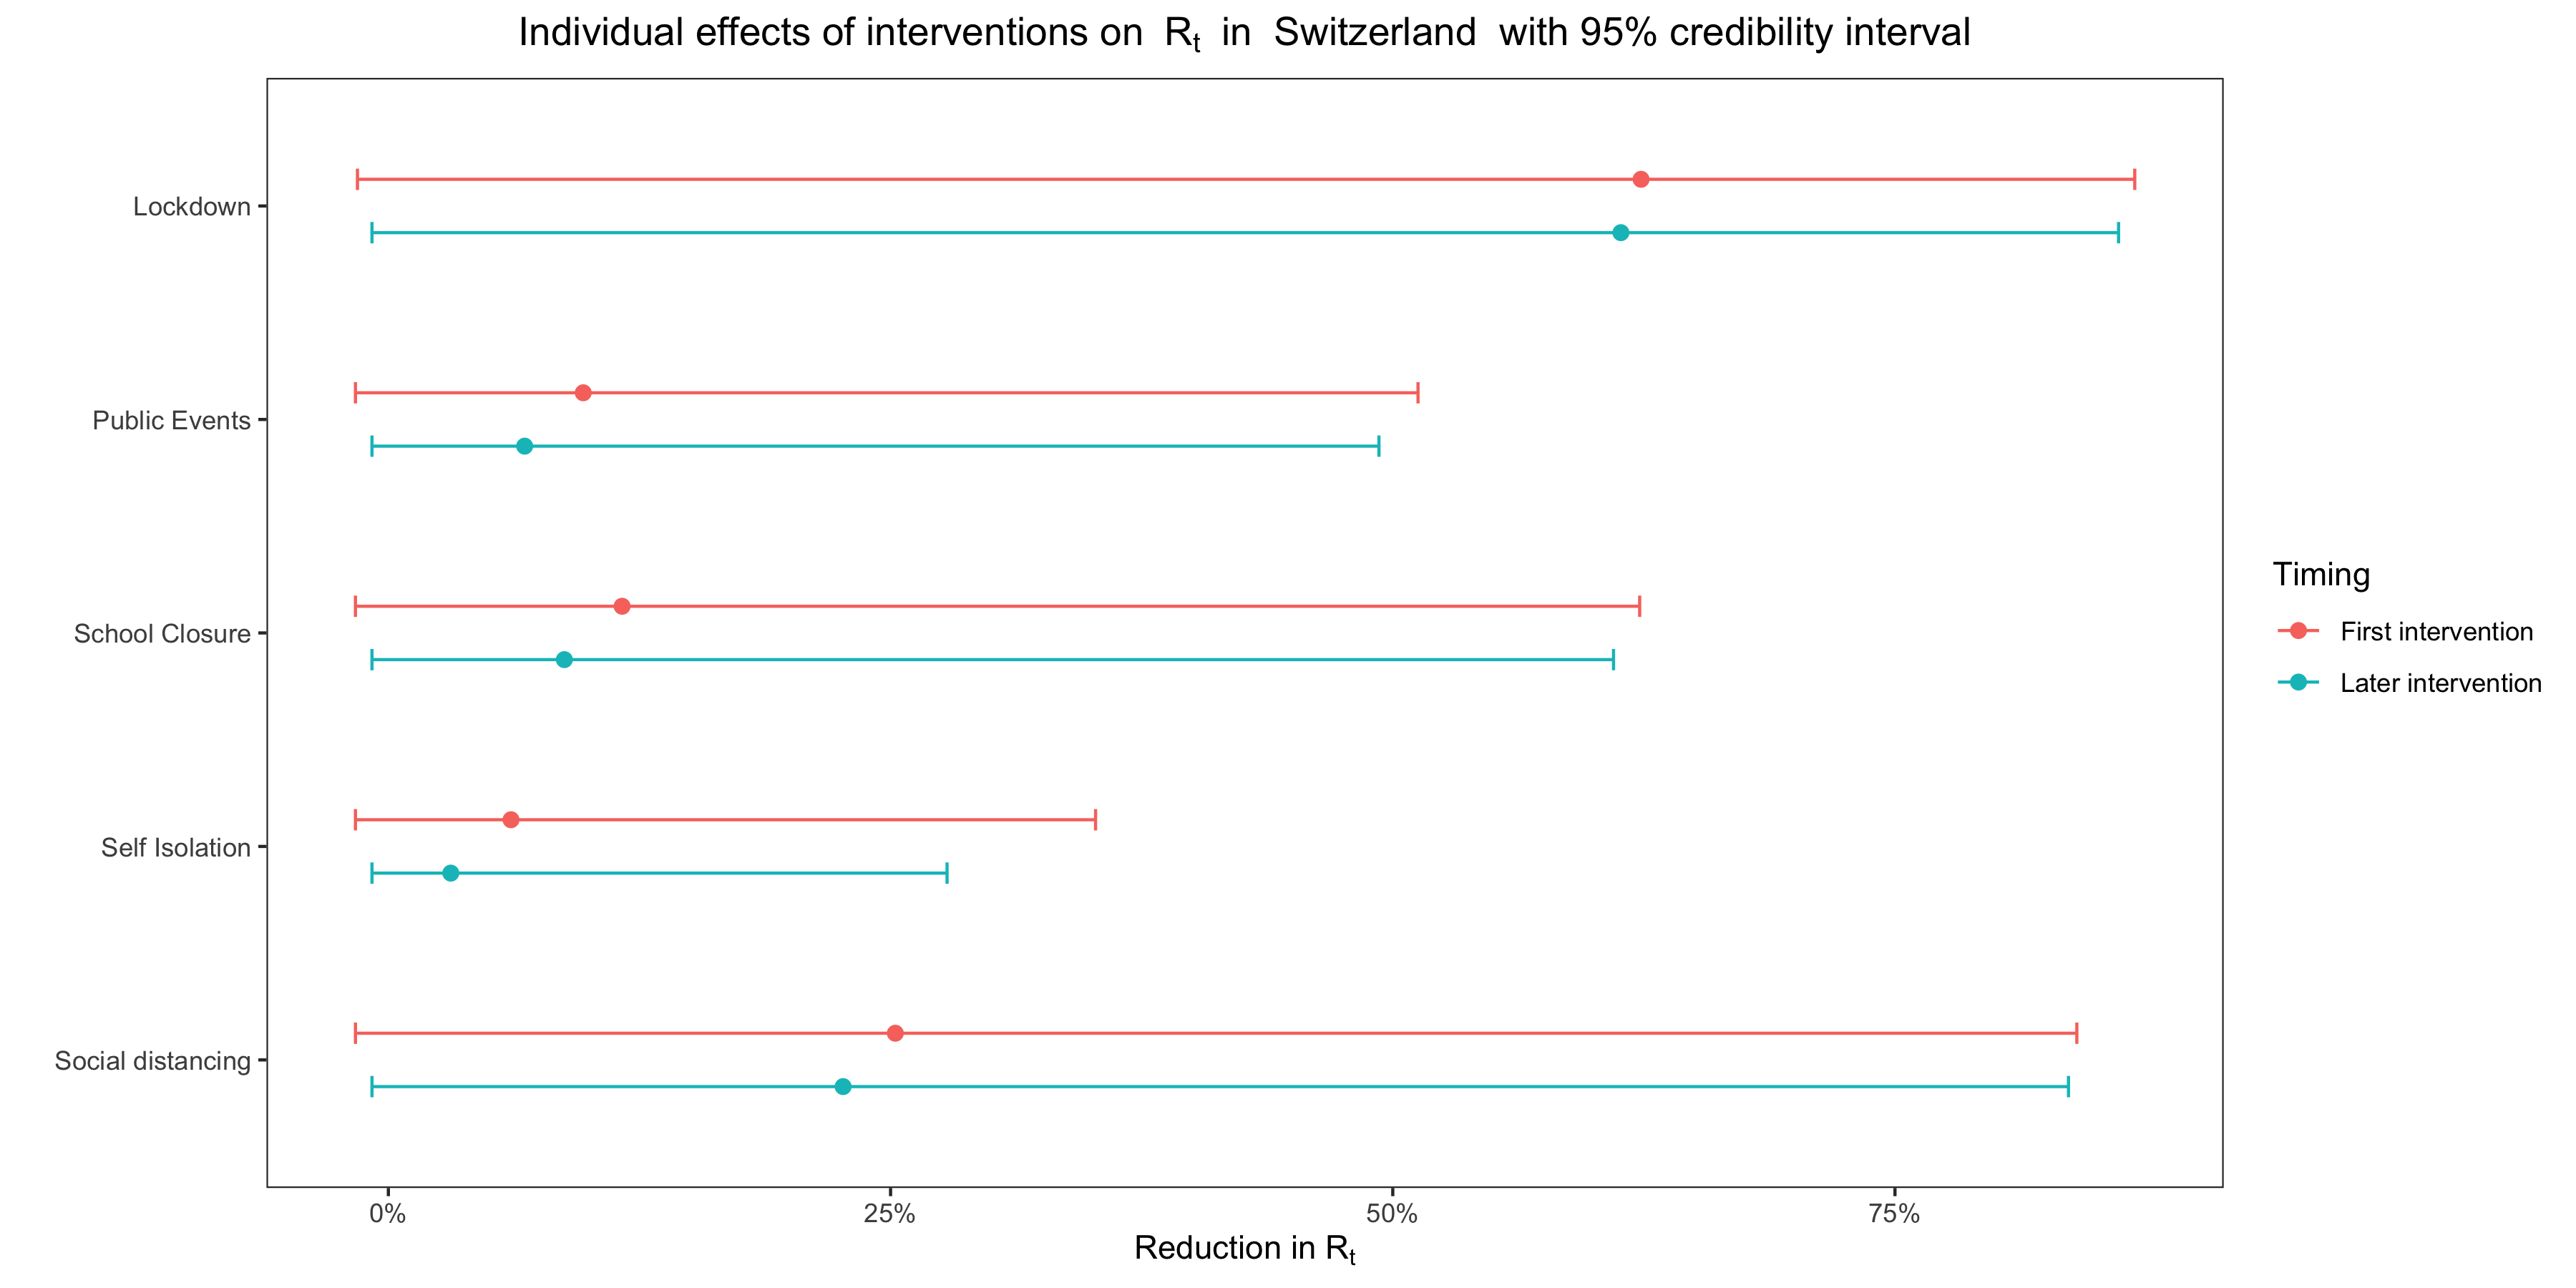 This is not really surprising given that, in many countries, several interventions were implemented on the same day, but except in Belgium the credible intervals show considerable overlap with the effect of lockdown even in countries where that is not the case. Flaxman et al. interpret the more clear-cut results of the pooled model as a sign that it’s less sensitive to data reporting idiosyncrasies, but if you ask me it’s just as likely that it doesn’t mean anything.
But the most important point is that, as I just noted, the fact that in Sweden the model ascribed such a large effect to banning public events should have changed their conclusions, because it was a hint that, if their model ascribed the overwhelming majority of the effect on transmission to lockdown, it wasn’t because lockdown had been single-handedly responsible for breaking the epidemic but rather because, given the data on deaths and the timing of interventions, the model was bound to reach that conclusion even though it’s false. In order to verify this, I generated epidemic data with a simulation that assumes 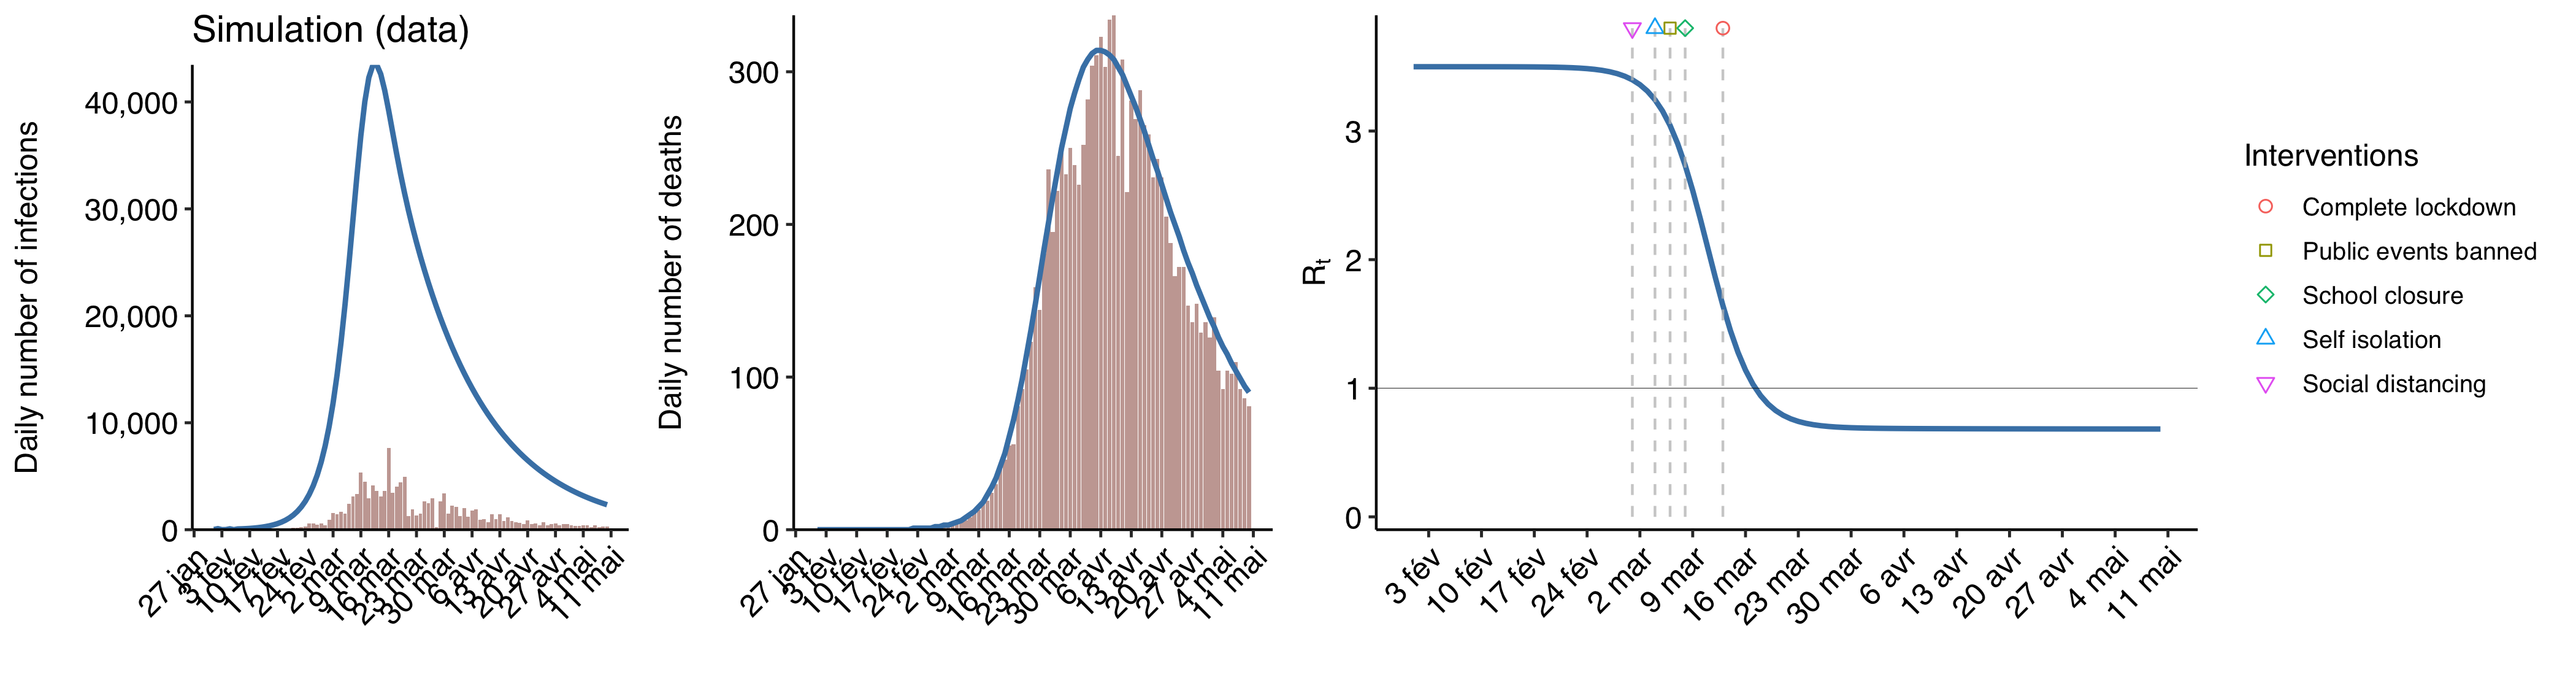 The blue curve shows the actual epidemic, while the bars show data on reported cases and deaths. I assumed that
I fit the model on the data about reported deaths and tell it that various interventions took place around the time that 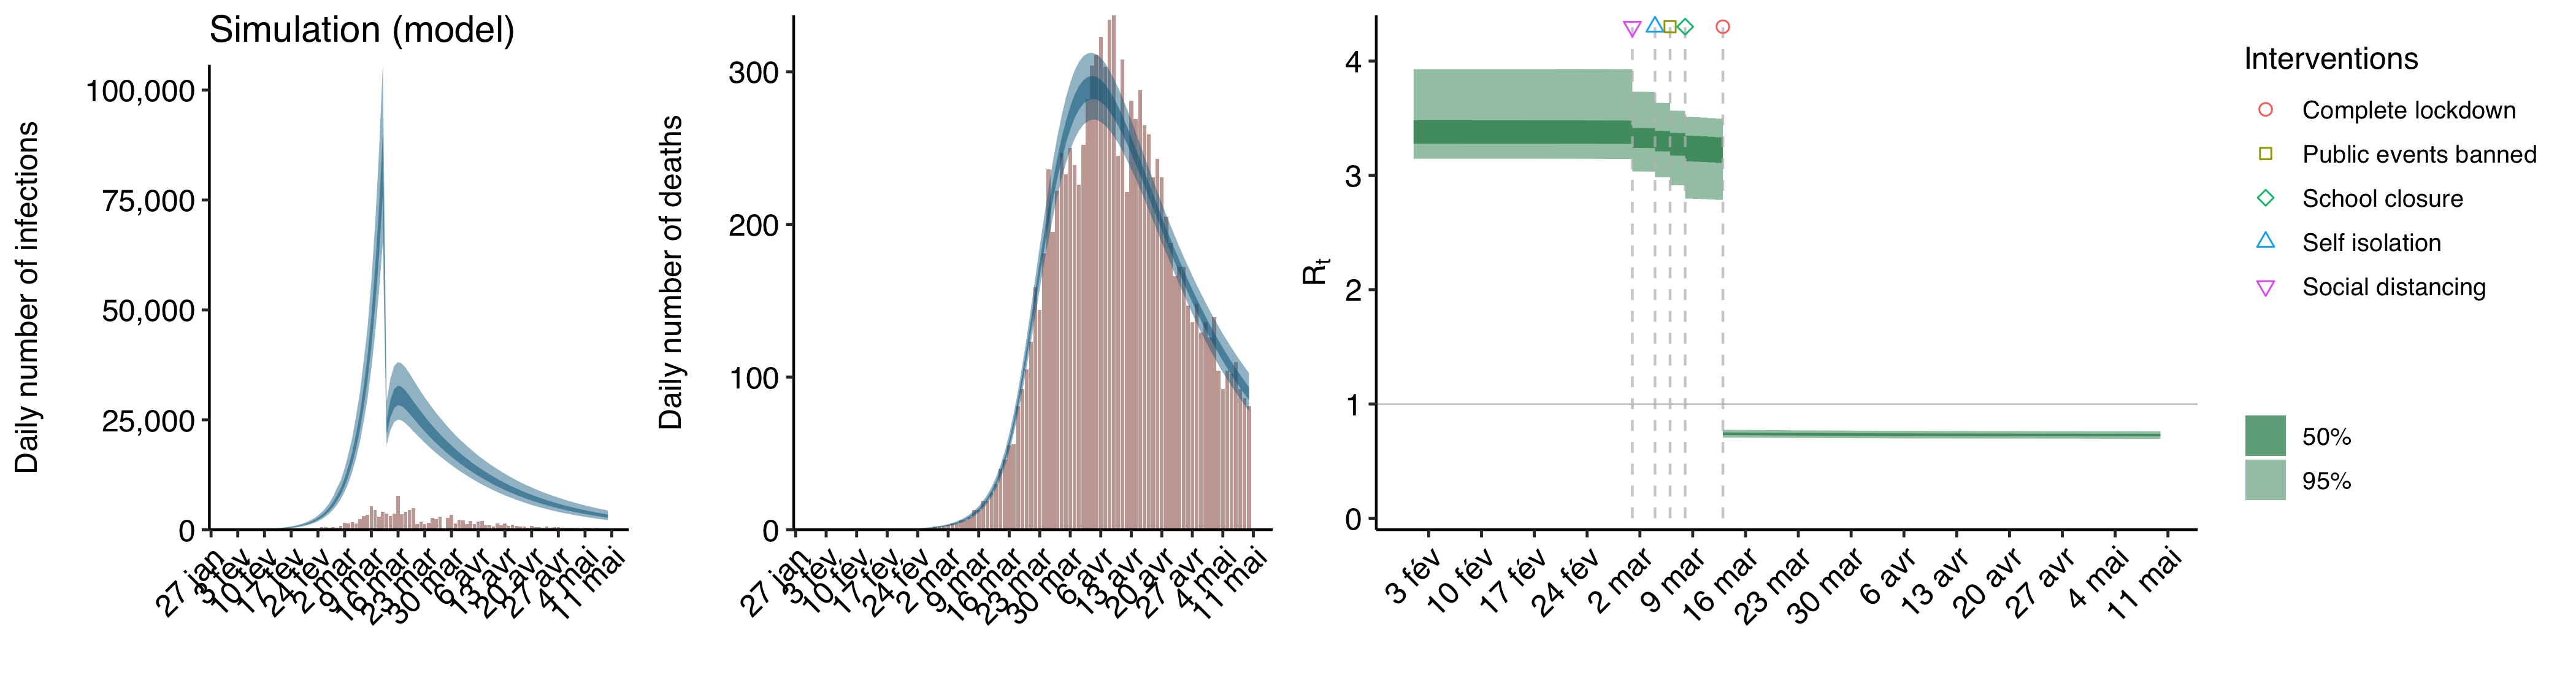 The blue line curve shows the epidemic as inferred by the model, while the bars show the observed data it used to infer the epidemic. As you can see, it looks exactly like the results of Flaxman et al.’s analysis of real epidemic data, with a sudden fall of
Based on what I have seen by playing a bit more with simulations, it seems that the model tends to ascribe most of the reduction in
It seems that it’s those purely mathematical considerations and the fact that lockdowns were implemented last and before or not too late after the peak of infections in every country, not the fact that lockdowns really are the only intervention that have a meaningful effect on transmission, which explain why the model reached that conclusion. (Of course, the lockdown probably had something to do with the fact that the peak occurred when it did, but my point is that it probably would have occurred around the same time even without lockdown and the model would have ascribed a huge effect to the previous intervention, as in Sweden.) Indeed, if this were not true, it’s extremely unlikely that it would also have found that banning public events, the last intervention in Sweden, had a very similar effect on
We don’t know enough to make causal inferences from the data
I have shown that Flaxman et al.’s model would also fit simulated data that were generated by a completely different process than it assumes, but can a model that assumes this kind of process also fit the actual data? Yes. Here is what happens when I fit on France’s actual data a model that, instead of assuming that 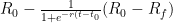


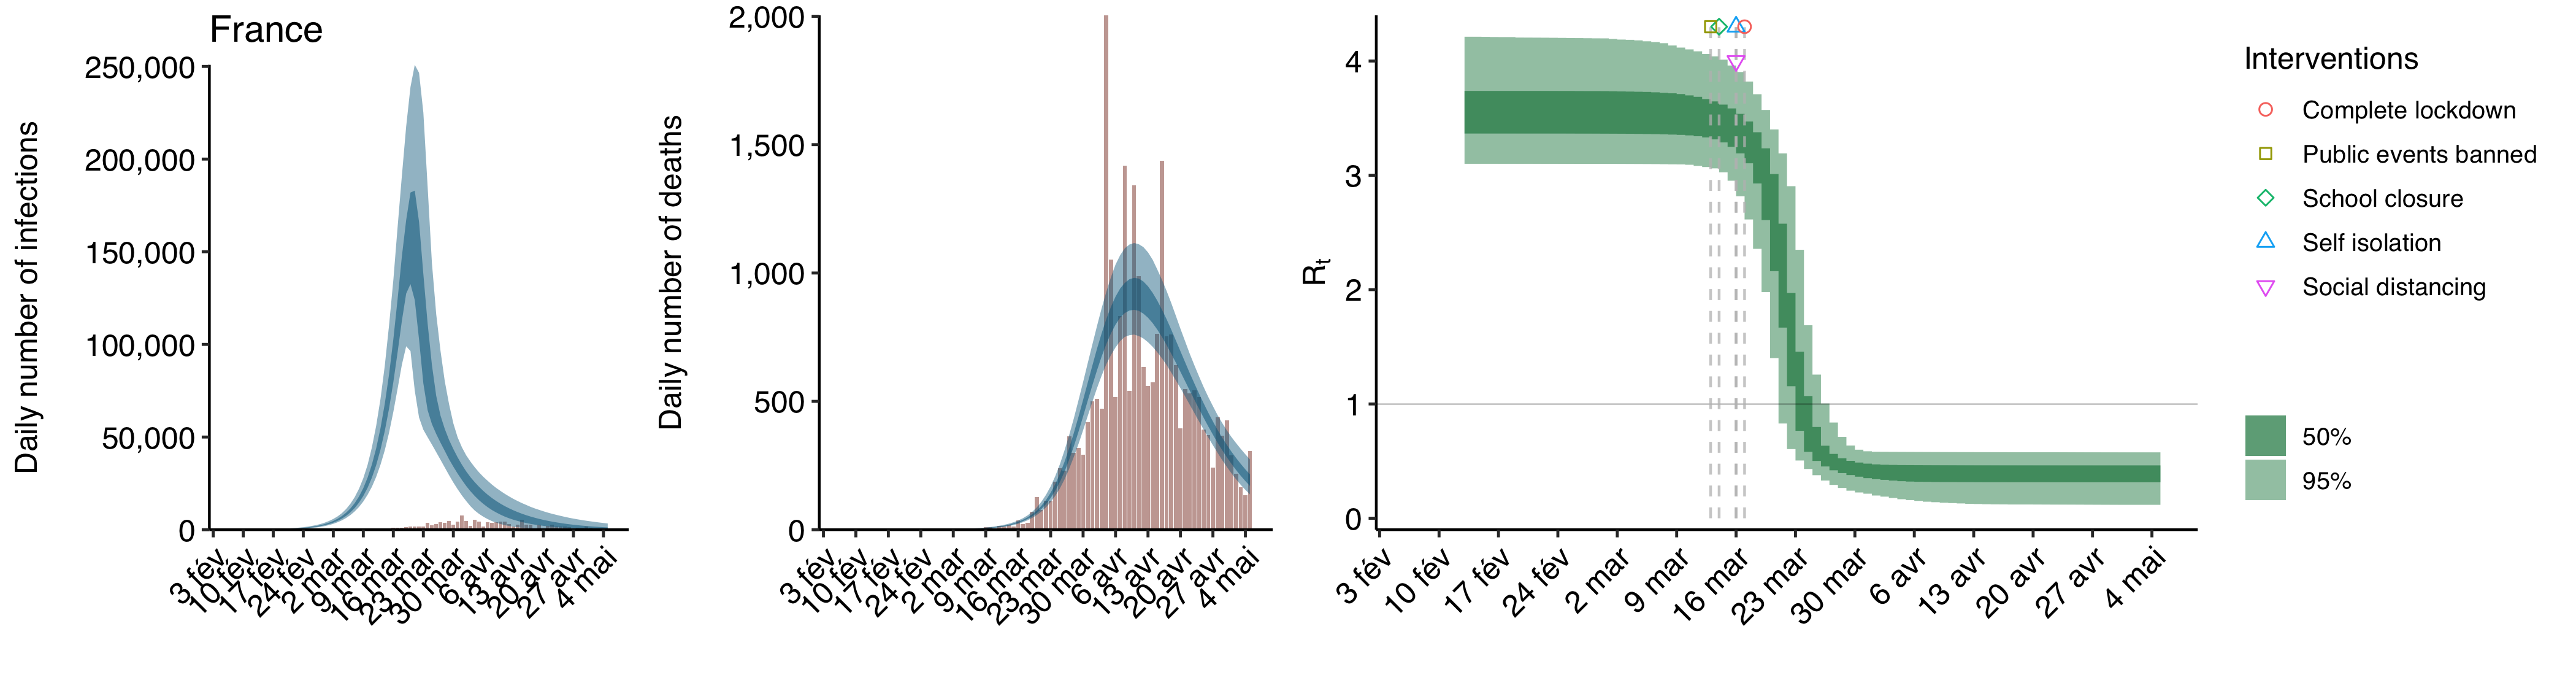 As you can see, the fit is very good. I didn’t even bother computing any goodness-of-fit statistics, because I did this very quickly just to show that it could be done and I have no doubt that I could improve the fit by tweaking the model, but it’s clear just visually that it’s about as good as the fit of Flaxman et al.’s non-pooled model and perhaps even better.
Now, this model doesn’t make any assumptions about the effect of interventions, it just estimates the values of 
 As you can see, by the time the lockdown came into effect,
Of course, I’m not saying that you should be committed to this model, since there is no reason to believe that
Some philosophers of science actually think that the underdetermination of theory by the data implies that we are never justified in believing that scientific theories, which explain phenomena by positing all sorts of unobservable entities and processes, are true. But most people still think that, despite the underdetermination of theory, we can sometimes figure out the causal structure of the world. The reason is that, although there are always many different theories that can explain the data, we often have background knowledge that we can use to rule out most of them. (It usually doesn’t rule out all of them, so in order to decide between the remaining theories, we have to make judgments about their relative explanatory power, a concept that philosophers of science also have discussed at length.) In the case of the pandemic of COVID-19, however, I don’t think we have enough background knowledge to estimate the effect of non-pharmaceutical interventions with the kind of data Flaxman et al. used.
In general, in order for statistics to be useful to learn something about the data generating process, you have to already know enough about the data generating process, because statistical techniques always rely on assumptions about the data generating process and are likely to mislead you if those assumptions are false. But I don’t think we know enough about how non-pharmaceutical interventions affect transmission to come up with a model that, knowing only how many deaths were recorded on each day and when each intervention came into effect, we can trust to estimate accurately the effect of each intervention on
As we have seen enough, we know enough to say that Flaxman et al.’s model is unrealistic in several ways even before we have used it to estimate the effect of non-pharmaceutical interventions, but it’s hard to know before looking at the data how much it matters. However, as I have argued above, once you fit the model on the data and see what the results look like for Sweden, it becomes clear that it’s actually very misleading and that we shouldn’t take seriously the main conclusion Flaxman et al. draw from their results. This would have been clear if they had not swept under the rug the fact that the model estimated a huge country-specific effect for Sweden, but we didn’t need a complicated mathematical model to reach that conclusion, we just had to take a look at the deaths curve for Sweden and notice that, although there was no lockdown and the country only resorted to mild forms of the other interventions,
Using another counterfactual to estimate how many lives were saved by lockdowns
As we have seen, in order to estimate how many lives non-pharmaceutical interventions have saved in Europe during the first wave, Flaxman et al. used a counterfactual in which not only are there no such interventions but people’s behavior doesn’t even change, so the only thing reducing transmission is immunity building up in the population. (Even in this scenario, their model is probably not reliable because it assumes homogenous population mixing, but this is not important.) This counterfactual is not very interesting because virtually nobody is recommending that governments do nothing to contain the epidemic. The debate is about what kind of interventions should be used to do so. One reason people disagree about that is that they disagree about the benefits of different types of interventions. (Another reason is that they disagree about the costs of different types of interventions. There is a lot to be said on that issue, but this post is already long, so I will leave that for another time.) In particular, people disagree about how much lockdowns reduce transmission and how many lives they can save, so a more interesting counterfactual is a scenario in which there was no lockdown but European governments nevertheless took more limited steps to contain the epidemic with less stringent restrictions.
Since Flaxman et al. concluded that lockdowns were single-handedly responsible for almost the entirety of the reduction in
Here is a table that compares how many lives are saved in each country if we use Flaxman et al.’s counterfactual to how many lives are saved if we use this counterfactual when the pooled version of the model is used: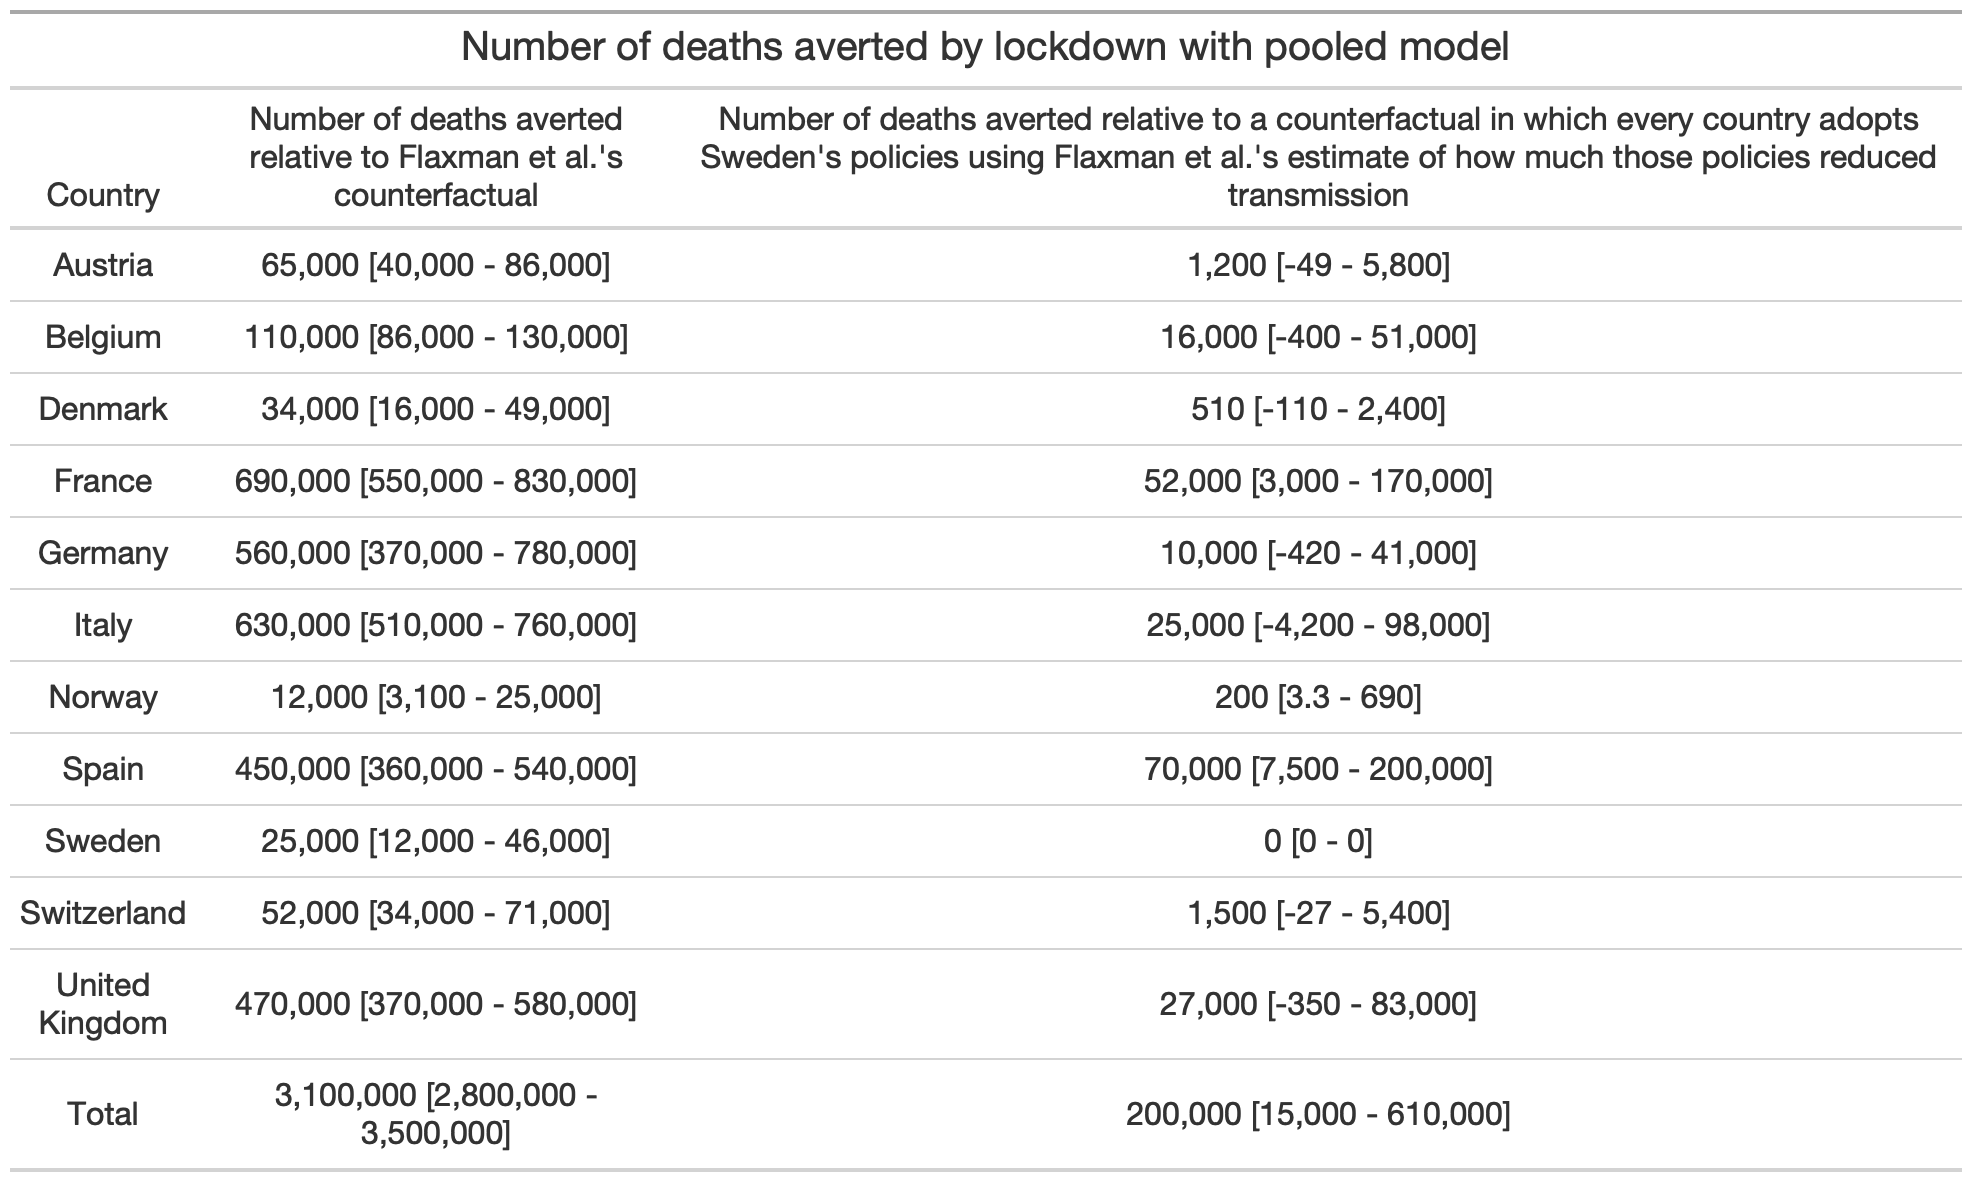 As you can see, relative to Flaxman et al.’s counterfactual, the number of lives saved is divided by ~15.
Here is another table that shows the same thing but when the non-pooled version of Flaxman et al.’s model is used: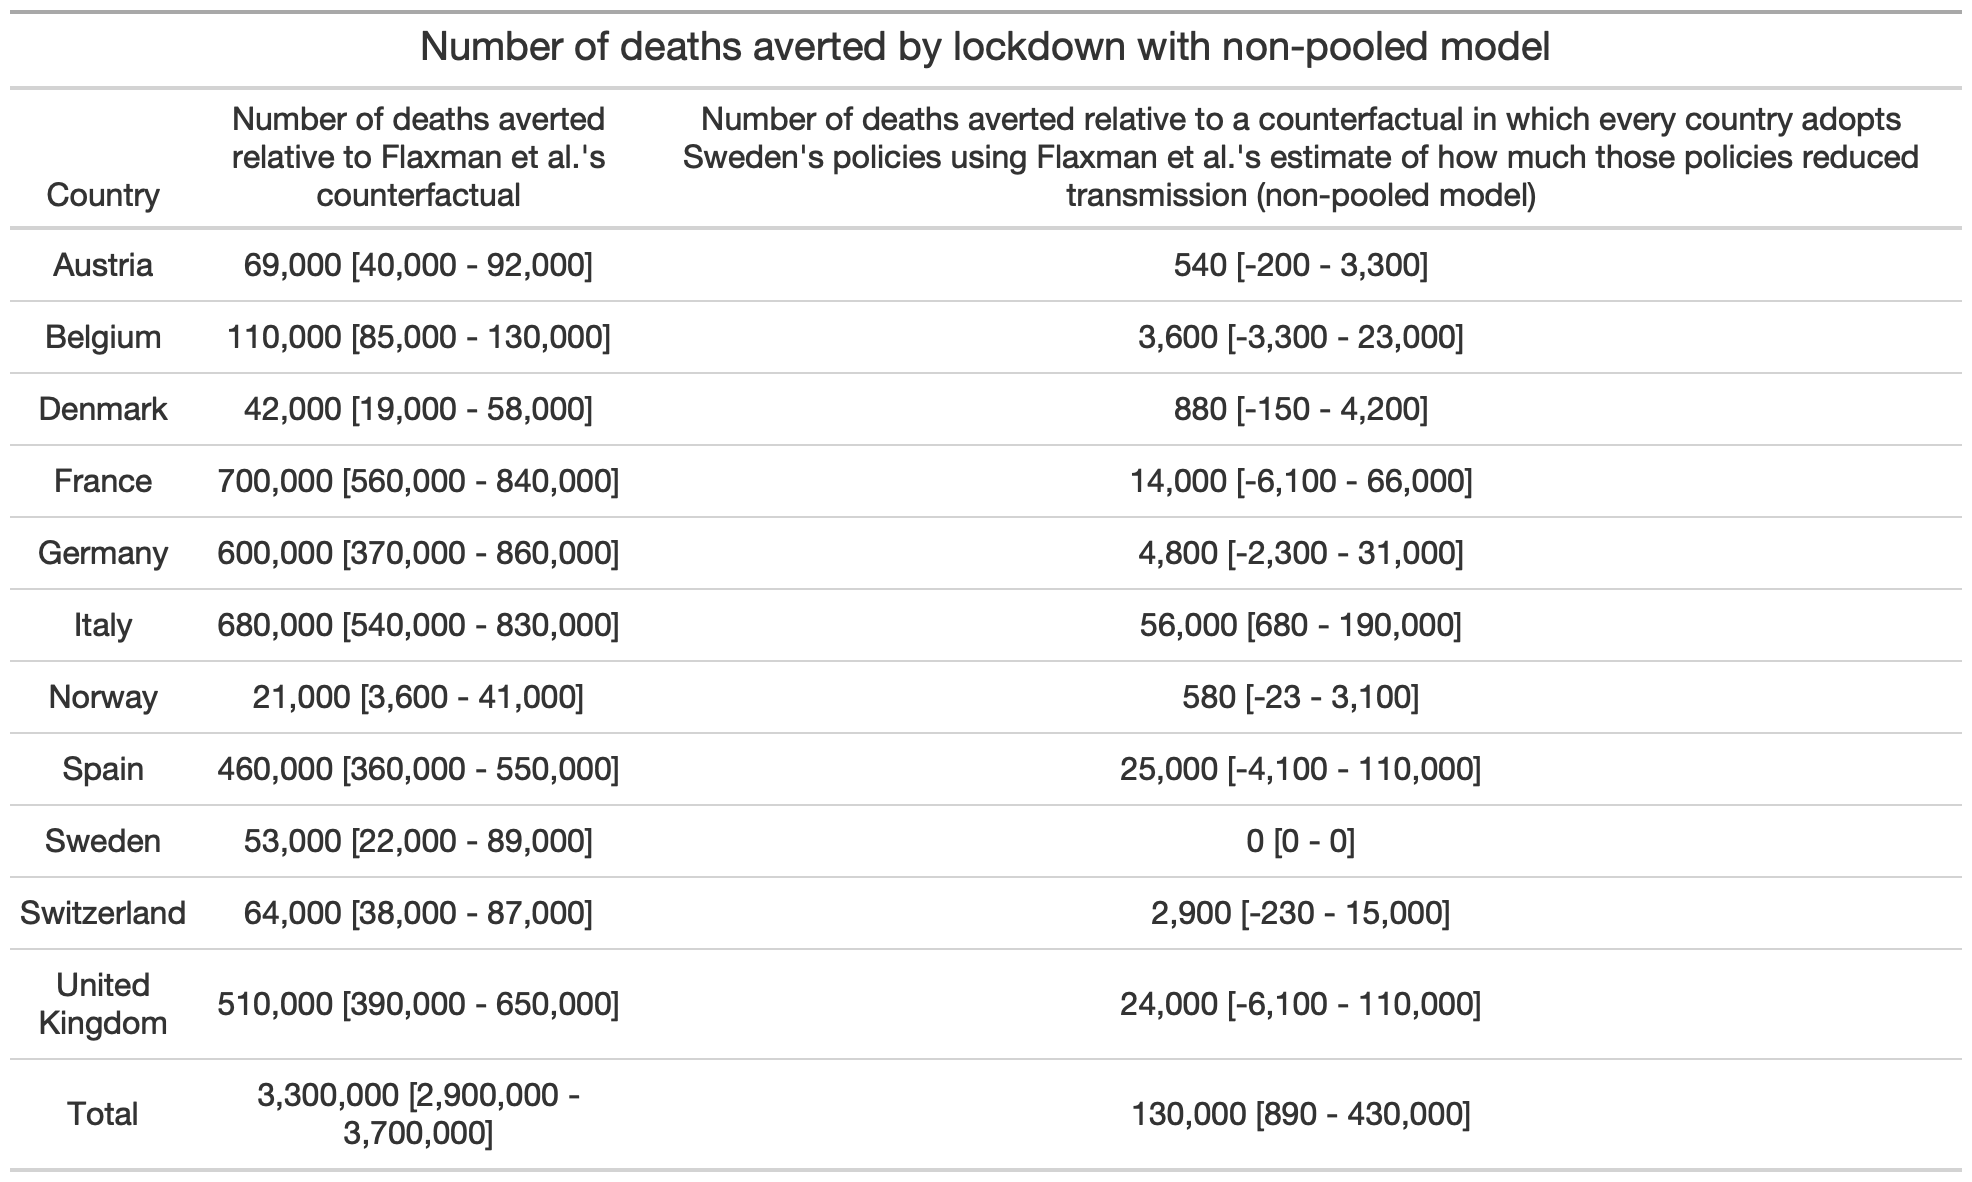 With this version of the model, compared to Flaxman et al.’s counterfactual, the number of lives saved is divided by ~23.
To be clear, since they are based on Flaxman et al.’s estimate of the overall effect of non-pharmaceutical interventions in Sweden and their model is clearly misspecified, I don’t think we should take very seriously either of these estimates, though we should definitely take them more seriously than Flaxman et al.’s preposterous estimate. What really matters is that my counterfactual is based on Flaxman et al.’s estimate of how much interventions reduced transmission in Sweden, where there was no lockdown, which goes to show how ridiculous it was for them to conclude that only lockdowns have a meaningful effect on transmission. Again, if they were able to defend that conclusion anyway, it’s because they swept under the rug the fact that their model found a huge country-specific effect for Sweden’s ban of public events. (In the non-pooled model, the effect of the ban itself is comparable to the effect of a lockdown in the rest of Europe.) If they had made that clear, they couldn’t have defended this conclusion, because nobody would have bought that, for some mysterious reasons, banning public events had a several orders of magnitude larger effect in Sweden than anywhere else in Europe.
I actually think their model probably overestimated
Speaking of confused arguments, many people claim that, since Sweden’s neighbors only had a fraction of the deaths it did, most of the deaths in Sweden could have been prevented with a lockdown. Of course, you would reach a completely different conclusion if you compared Sweden to some other countries, such as Spain, that recorded more deaths per capita despite having a lockdown. But people argue that we should only compare Sweden to its neighbors, because they have a similar culture, so they provide the best counterfactual. However, this argument is totally unconvincing, because in any country the epidemic is affected by countless factors and we don’t have a very good idea of what most of them are. Culture is probably one of them, but it’s not the only one and almost certainly not the main one. We also don’t know exactly what aspects of culture matter. It could be that, although overall Sweden is culturally closer to other Nordic countries, it’s actually closer to other European countries with respect to the cultural factors that matter the most for the pandemic. So we are in no position to claim that other Nordic countries provide the best comparison. This is a very basic and obviously correct methodological point, I don’t think it would be remotely controversial if Sweden had not become such a fixation in the debate about the best policy response to the pandemic, but unfortunately it has and that’s why I see people who teach causal inference professionally make this argument all the time.
Again, I don’t think we should take very seriously the estimates of the number of deaths averted by lockdowns I obtain with my alternative counterfactual, but I still think that looking at the estimates for Denmark and Norway in the table I showed above should give pause to people who find the argument that we should only compare Sweden to its neighbors convincing. Indeed, according to this table, Denmark and Norway barely saved any lives by implementing lockdowns rather than using only the same, less stringent restrictions as Sweden. (Although it’s worth noting that, compared to lockdowns in countries such as Spain, Italy or France, the lockdowns in Nordic countries were pretty lax, so the difference with Sweden was never as big as most people imagined anyway.) The precise estimates I obtained don’t mean a lot, because they are based on Flaxman et al.’s model which as I have argued is misspecified, but they nevertheless suggest that even if Denmark and Norway had only been able to reduce transmission as much as Sweden, they would still have significantly fewer deaths per capita. I think what mattered the most for the eventual death toll, beside perhaps how much “dry tinder” there was in Sweden compared to its neighbors, is the timing of the interventions relative to that of the epidemic.
All European countries implemented their interventions around the same time, but for whatever reasons (which had nothing to do with policy), the epidemic just happened to be more advanced in some countries than others by the time this happened and as a result more people died over there. If more people died in Sweden than in other Nordic countries, it’s not just because there was more “dry tinder” and the government adopted a more relaxed policy in Sweden, but probably also because other countries were lucky that, by the time interventions were implemented and people started to change their behavior as they realized the danger, the epidemic was still at a relatively early stage. But even if you think that all the COVID-19 deaths that occurred in Sweden during the first wave could have been prevented if the government had ordered a lockdown, which is preposterous, what this would mean is that ~5,000 mostly very old people were allowed to die so that 10 million others could live a much more normal life than anywhere else in Europe. Perhaps you think it wasn’t worth it, but if you think that’s obvious, then I’m sorry but you are delusional.
To some extent, European countries have learned that complete lockdowns were unnecessary to contain the epidemic and didn’t pass a cost-benefit test, since they have implemented much less stringent lockdowns than what they did in the Spring to deal with the second wave and some of them, including Sweden’s neighbors (except for ~250,000 people in Denmark who have been put in lockdown to prevent the mutated virus that emerged in mink farms from spreading), have decided to forego lockdowns entirely. On the other hand, Sweden has decided to tighten restrictions somewhat, but while they are now pretty similar to the restrictions in other Nordic countries, they are still far more relaxed than what most European countries are doing. It’s a testament to how much ideology colors perception that people now seem to be convinced that Sweden has decided to adopt the policies used in the rest of Europe, when it’s completely obvious to anyone who actually looks at the facts that other European countries have moved closer to the policies used by Sweden in the Spring than the other way around. However, in many cases, I think the restrictions they used are still more stringent than what is desirable from a cost-benefit perspective and certainly more stringent than what is necessary to push
Conclusion
I have no doubt that lockdowns saved lives, but they didn’t save nearly as many as people think and they certainly didn’t save 3 million lives in Europe alone during the first wave, as Flaxman et al. claim. They use sophisticated statistical techniques to reach a conclusion that can be rejected with a high degree of certainty just by eyeballing a chart. Their paper is a prime example of propaganda masquerading as science that weaponizes complicated mathematics to promote questionable policies. Complicated mathematics always impresses people because they don’t understand it and it makes the analysis look scientific, but often it’s used to launder totally implausible assumptions, which anyone could recognize as such if they were stated in plain language. I think it’s exactly what happened with Flaxman et al.’s paper, which has been used as a cudgel to defend lockdowns, even though it has no practical relevance whatsoever. The truth is that, with the data and methods they used, it’s impossible to estimate the effect of non-pharmaceutical interventions and anyone who claims otherwise is selling snake oil.
To be clear, while I personally think it’s best to avoid lockdowns, I don’t claim to have demonstrated that. I only claim that, even if you think that lockdowns are the way to go, you shouldn’t use Flaxman et al.’s paper to argue for that view, because it has no practical relevance whatsoever. People sometimes ask why I joke that I’m anti-science, but this is why. Scientific journals, even very prestigious ones, routinely publish this kind of papers that claim to have policy relevance but don’t actually have any. It’s essentially voodoo magic for the “I love science” crowd, where the colorful rituals have been replaced by scary-looking mathematical formulas. This is especially likely to happen when, as in the case of the pandemic, the topic is politicized. As they say about sausages, once you know how they’re made, you often no longer want to eat them. Well, with science, it’s the same thing.
Finally, a lot of people have criticized preprints and stressed the importance of peer review during the pandemic, but note that the problem here isn’t the lack of peer review. Flaxman et al.’s paper was peer reviewed and published at one of the most prestigious scientific journals in the world, but it’s still garbage. In fact, not only was the problem not the lack of peer review, but I think this episode illustrates some of the problems with pre-publication peer review. Although I can’t prove it, it’s very likely that Flaxman et al. decided to hide the country-specific effect for Sweden because they knew that it would make it more difficult for them to publish their paper in Nature and scientists have very strong incentives to publish in prestigious journals, which would not exist if we abolished pre-publication peer review and journals as they currently exist. Moreover, precisely because it was peer reviewed and published in a prestigious journal, this paper was able to play a huge role in the policy debate. If pre-publication peer review didn’t exist, on the other hand, it would just have been another paper without the credibility granted to it by peer review and the affiliation with a prestigious journal, which always impress people who can’t judge the quality of a scientific paper and even many who can.
ADDENDUM: Some people seem to think that I’m a bit harsh on Flaxman et al. when I say that sweeping under the rug Sweden’s huge country-specific effect comes very close to scientific malpractice. One suggestion I have read is that perhaps they didn’t notice that the country-specific effect was so huge for Sweden, but I don’t buy that for a second. First, as I noted above, it’s pretty obvious from the results they describe in the paper that Sweden’s country-specific effect must be gigantic. There were 15 co-authors on this paper, so if I noticed it even though I have no formal training in epidemiology, I don’t see how it’s possible that none of them did. But perhaps more importantly, they published this figure in the supplementary materials, which shows the combined effect of the global and country-specific effects of lockdown for each country: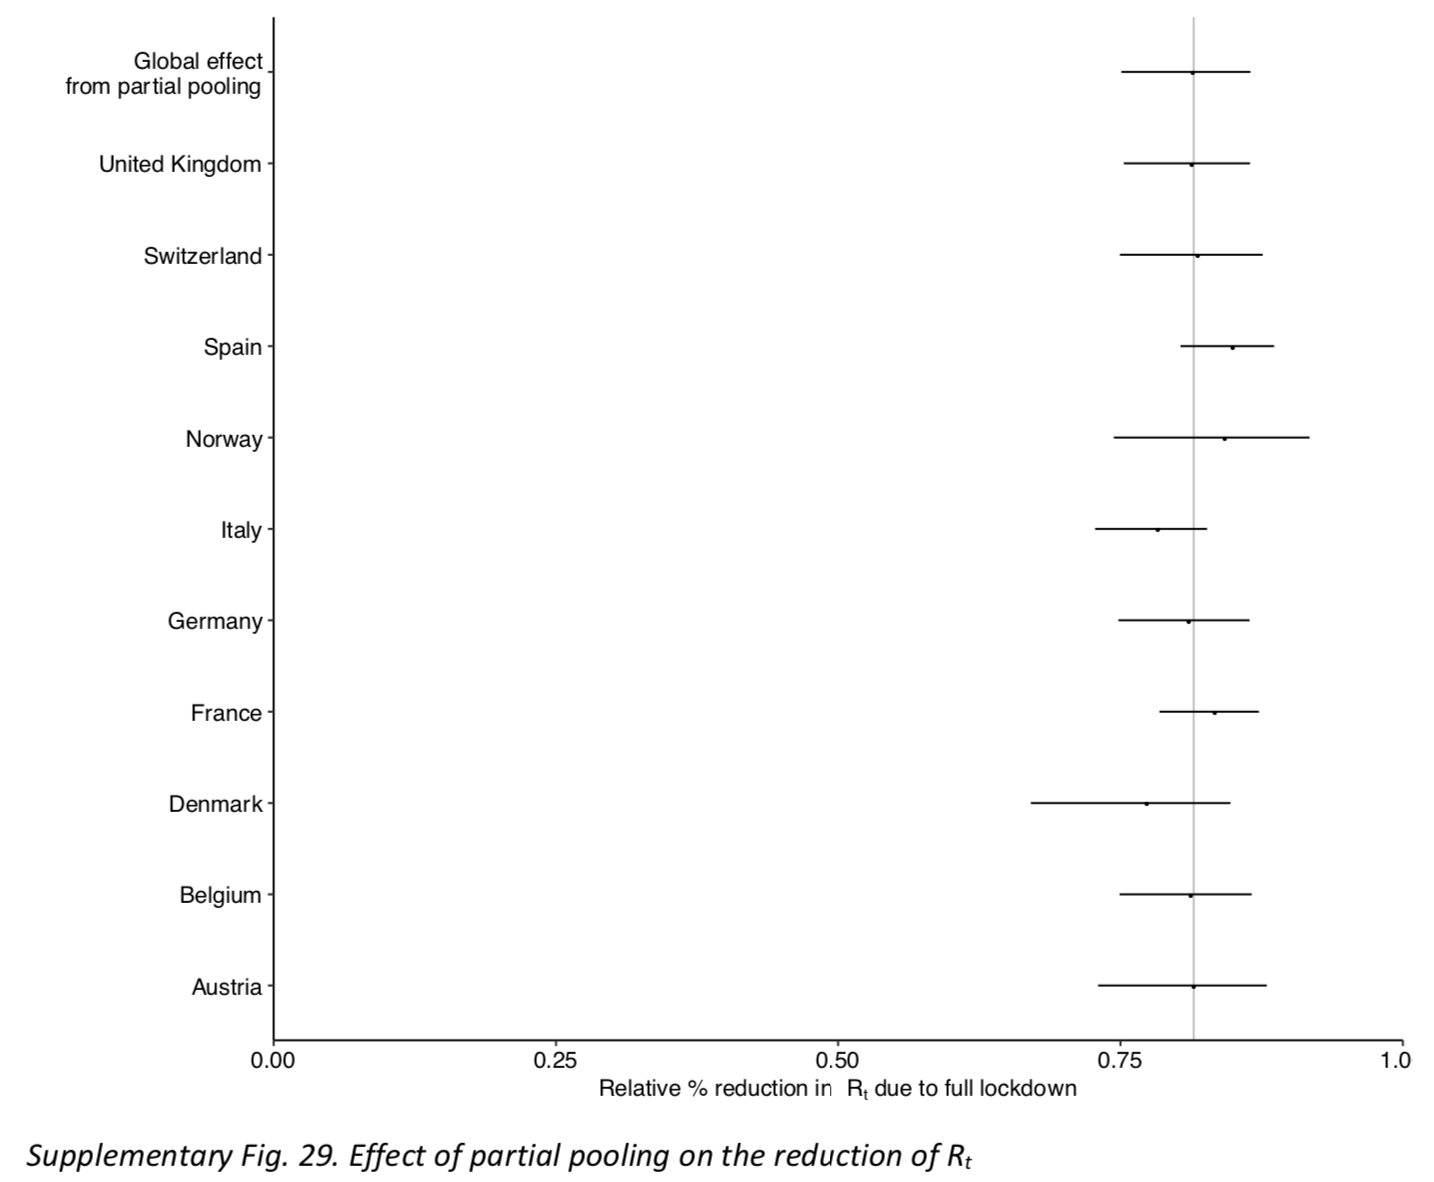 So I know that they looked at the country-specific effects, because they had to in order to make this figure. Moreover, this figure conveniently omits Sweden and, by combining the global effect of lockdown with the country-specific effect, it hides the fact that the credible intervals on the country-specific effect are extremely wide. You could say that, since this chart is only about the impact of pooling on the effect of lockdowns, it made sense to exclude Sweden, but it doesn’t actually make sense to exclude Sweden if you want to assess the impact of pooling, even if the last intervention in Sweden wasn’t a lockdown. In any case, if they looked at the country-specific effects to make this figure (which again they had to), it beggars belief that they didn’t also look at the effect in Sweden, especially given that it’s the only way to make sense of the results they present in the paper. So of course they knew about this problem, they just swept it under the rug because they knew it was undermining their conclusion, without which their paper would probably not have been published in Nature. If they told me that they didn’t know about it, I simply wouldn’t believe them and neither should you. There is a difference between charity and stupidity.
EDIT: I fixed the table that showed the number of lives saved when you use the alternative counterfactual with the non-pooled model, because there was a mistake in the row about Sweden. (In this counterfactual,
Vous qui étes doué en math , vous devriez produire les données des morts évités si le normal était en place, pays par pays :
Vitamine D : les incroyables découvertes françaises !
https://infodujour.fr/sante/43730-vitamine-d-les-incroyables-decouvertes-francaises
https://en.wikipedia.org/wiki/Vitamin_D#/media/File:Vitamin_D_serum_levels_in_adults_world_map.svg
Je n’ai pas étudié la question du rôle de la vitamine D, donc je n’ai pas d’avis sur la question, et malheureusement je n’ai pas le temps pour me pencher là-dessus.
Thanks for the work you put in on this. I hope the authors respond to your criticism. The scientific process is messy at best, and worse when politics and the need for emergent policy decisions become factors.
“In this chart, I have plotted the country-specific effect of the last intervention in each country:”
This graph does not show because the link is wrong (I guess).
Damn! I thought I had fixed the problem and it shows on my computer. Can you please try reloading the page and tell me if it still doesn’t show?
it worked after I send my comment. But I was to busy to post again. It seemed to have been a caching Issue I opened the article long before I read it… sorry to have bothered you. should have checked if it was fixed before writing.
Best nehrwert
Great, and no worries, thanks for letting me know!
Very informative; your stuff on COVID is always great. Curious to see what you eventually have to say about the normative side of things, what to do now and what to do next time.
Sweden is certainly an interesting case. Obviously things have gone well there overall. I really hesitate to generalize… I don’t know if I’d say it was a matter of “culture,” but for whatever reason the Scandinavian social democracies are magical places where everything seems to turn out right. You see this in all sorts of ways. I’m open to the idea that the best approach is something like “Sweden plus mask mandate (or at least don’t discourage mask use like they did).” Unless it becomes clear from later research that surgical masks don’t work, which is a live possibility IMO.
But if you’re not going to lock down, do you really hold to that plan when it looks like you’re going to run out of beds in a few weeks? Or is the idea that it should be an absolute last resort? I think we’ve been too quick to assume that we’re about to run out of beds in the past, but Lombardy illustrates that it can happen.
I think when it comes to the “next time” question we have to clearly distinguish two scenarios: (1) something like this happens again, vs (2) something considerably worse happens, like what avian flu could turn into eventually.
The latter would be something closer to what Contagion portrays, 10x or more as lethal and also killing kids, etc. In that case I think the opening strategy has to be basically what China did in Wuhan once they got moving.
If another type (1) virus arises again, though, I’m really torn about what to do. Another important case study is Australia. They’ve really stomped the virus, but at huge economic cost up front. Was that worth it? I have no idea.
If one is going to conclude that the best way forward is light restrictions only, I’m tempted to say that the Russian strategy (or rather, the strategy Russian propagandists said they were pursuing) is the best: just get a barely-tested vaccine out there ASAP. It seems like our prior should be that the side effects of a vaccine will be much less than the side effects of infection.
Anyway, just some unedited thoughts. Looking forward to your next piece on this.
The other thing I just don’t get is why they couldn’t ramp up N95 or P100 production enough to distribute those widely among the populace. If everyone wore a $5-40 respirator when they went out for three weeks, the whole thing would be over.
I’m skeptical this would work for at least two reasons:
1) my understanding is that N95 really are more effective than surgical masks only if they’re worn correctly and most people without proper training don’t wear them correctly and
2) it would crucially hinge on the population’s compliance, people would presumably have to wear them even at the office, but I don’t think it would happen.
I should’ve been clear this was a bit hyperbolic! But if everyone wearing a mask right now were wearing a respirator that cuts the attack rate in half or more, it would be a huge difference.
I’m suspicious about the slogan that N95s are only better when they’re perfectly fitted, because (just like “masks don’t work”) it’s the sort of thing that’s both tough to study and very convenient for those whose top priority is to make sure that sufficient PPE is reserved for health care workers. But regardless, P100s are easy to wear properly as long as you don’t grow a beard.
Thanks, I don’t have time to reply to all the points you raise, but I just want to say that I don’t agree with everything about Sweden’s approach. In particular, I think their stance on masks is just stupid, but still there is no question that on the whole they handled this better than France and most other Western countries. I’m not sure what to think about Australia and New Zealand. On the one hand, I have to admit that I didn’t think they’d be able to keep the epidemic under control during winter, but clearly I was wrong. On the other hand, for various reasons (such as the lack of geographic isolation), I’m not sure the same thing would have been possible in Europe or the US. But the most important point in my opinion is that, as you noted, their strategy is extremely costly and I just don’t think it’s worth. If you can get the kind of results Sweden did with a similar strategy, then I think it’s superior from a cost-benefit point of view. I get your point about the danger of generalizing from the experience of Nordic countries, but I think what happened in the rest of Europe, where much less stringent restrictions were used to contain the epidemic during the second wave, shows that it’s generalizable. Of course, as I noted in the post, there is no reason to think that exactly the same level of restrictions will be optimal in different countries or even in different regions within the same country, but I think you can get roughly the same number of deaths per capita, perhaps a bit more or a bit less depending on the situation, as Sweden with much less stringent restrictions and that’s what I would favor. The questions you ask about what should be done with a different kind of virus are interesting, but I don’t really have clear thoughts about that, I would have to think more about it. Eventually I will talk about the cost-benefit debate, because as I say in my post I think people have been making extremely confused, and sometimes frankly embarrassing, arguments about that, but it will be focused on this pandemic. But first I want to write another post in which I will show that, if Sweden had more COVID-19 deaths than its neighbors, it didn’t have much to do with policy, because even people who have read this post and found the main points convincing often continue to believe that, yet I think there is a very strong case against this view.
Great, I’ll look forward to your next piece.
I’ll just add, we also have to be careful about not just fighting the last war, the next time this happens. The measures we took this time would’ve been impossible with 20-year-old technology. If it’s 20+ years until the next pandemic, it may be that what Australia accomplished at great expense this time around will be achievable cheaply the next time, even in a chaotic country like the US where (with hindsight) it never would’ve worked in 2020. Or it may be that mRNA vaccines are a real revolution, and the next time around we’ll just have a known working vaccine in a month’s time.
c’est une syndémie , tous ceux qui traitent cela comme une épidémie se fourvoient.
I found this post very informative Phillipe, keep up the good work. I found that this served as a useful complementary piece, if only to raise more questions:
https://arstechnica.com/science/2020/11/trying-to-figure-out-which-policies-control-the-pandemic-best/
You criticize the argument that other Nordic countries are a better basis for comparison, so as to attempt to control for confounding variables, than other European countries – by limiting that argument to one that is based merely on “cultural” similarities n saying that we can’t reasonably speculate for a kind of common sense sensitivity analysis as w to which cultural similarities might be more predictive.
But that seems like a bit of a strawman to me. Indeed, I do think we can reasonably speculate there there are some important cultural similarities, with respect to correlating with outcomes from the pandemic, between the Nordic countries – such as a “normal” level of “social distancing” physical touching or kissing or “personal space” in every day life. But there are other important less directly “cultural” similarities that stand out as well. Not as perfect congruencies. Of course there would be variations. And of course there might be some other countries which are more similar to Sweden in regards to specific variables. But I think there are certainly other reasons in addition to merely cultural similarities why the other Nordic countries would, on a general basis, make a better comparison to Sweden to test the effect of an I NPI ntervention on health outcomes during a pandemic, as I think the Nordics have a grabbag of important similarities that would act as a kind of (imperfect) natural control for confounding variables as a group when there is no way to actually implement an experimental control. I offer some: SES, average age, average household size, population density and characteristics of population distribution, number/percentage of multi-generational households, % of immigrants in the population and characteristics of that immigrant population such as household size, ability of peope to work from home, availability of paid leave from work, access to daycare, access to healthcare, general features of the social safety net, baseline health status (such as # if comorbidities), policies for treating infected seniors living in congregate housing, compliance with laws or suggestions regarding social distancing, hand-washing, etc. I would imagine I missed some important ones.
Of course, I am only speculating here. As such, maybe I’m totally wrong – and actually adding up along all those vectors there’s no real greater “grabbag” of similarity among Nordics than there are when comparing Nordics to other European countries. Or maybe very few of any of those “vectors, ” as I’m calling them, will turn out to actually be significant correlates with outcomes from COVID. As such I’d be happy to read counter-arguments. But even short of that, I think it’s pretty uncharitable of you to just dismiss speculation that Nordics form a better basis of comparison to Sweden merely because they are based on some general assertion of cultural similarity that has no reasonable logic to it.
I should specify w/r/t my reference to average agwle also demographic variables associated with average age such as % 70, % (of elderly) living in congregate housing, life expectancy, etc.
FYI: Nature has very recently published a “Matters Arising” that has many of the same points as your blog post: https://www.nature.com/articles/s41586-020-3025-y .
HI Philippe, very interesting and helpful post(s)! I just wanted to draw your attention to this paper from late April (if you hadn’t already seen it) from some folks at ETHZ:
https://www.medrxiv.org/content/10.1101/2020.04.16.20062141v3
They were looking at the impact of various NPIs on documented cases and concluded that venue closures and bans on gathering had the highest impact on cases and (full) lockdown appeared to be the least effective NPI. (I wonder if they on any other researchers picked up / continued this piece of research since though).
Separately I wonder if you could comment on China. Because for lockdown advocates, if all other examples fail, point to China as a paragon of success. It would be nice to put that strawman to rest if possible. Thanks!