If you have followed the debate about how we should deal with the COVID-19 pandemic, you know that people have been fighting about Sweden since it decided to forego lockdowns and use a more relaxed approach. You wouldn’t know about that if you just read newspapers though, since the media has engaged in nonstop anti-Sweden propaganda for months. Recently, this has taken the form, among other things, of pretending that Sweden had abandoned its strategy upon realizing it had been a disaster. However, as I noted in my previous post, this is complete nonsense:
To some extent, European countries have learned that complete lockdowns were unnecessary to contain the epidemic and didn’t pass a cost-benefit test, since they have implemented much less stringent lockdowns than what they did in the Spring to deal with the second wave and some of them, including Sweden’s neighbors (except for ~250,000 people in Denmark who have been put in lockdown to prevent the mutated virus that emerged in mink farms from spreading), have decided to forego lockdowns entirely. On the other hand, Sweden has decided to tighten restrictions somewhat, but while they are now pretty similar to the restrictions in other Nordic countries, they are still far more relaxed than what most European countries are doing. It’s a testament to how much ideology colors perception that people now seem to be convinced that Sweden has decided to adopt the policies used in the rest of Europe, when it’s completely obvious to anyone who actually looks at the facts that other European countries have moved closer to the policies used by Sweden in the Spring than the other way around.
As I also noted in the same post, even during the first wave, lockdowns in other Nordic countries were very lax compared to what countries like Spain, Italy or France did, so the difference between Sweden and its neighbors was never as large as people think.
A few days after I wrote this, Bojan Pancevski published a piece in the Wall Street Journal that was a perfect illustration of what I was talking about:
After a late autumn surge in infections led to rising hospitalizations and deaths, the government has abandoned its attempt—unique among Western nations—to combat the pandemic through voluntary measures.
Like other Europeans, Swedes are now heading into the winter facing restrictions ranging from a ban on large gatherings to curbs on alcohol sales and school closures—all aimed at preventing the country’s health system from being swamped by patients and capping what is already among the highest per capita death tolls in the world.
As I noted on Twitter, Sweden has never tried to “combat the pandemic though voluntary measures alone”, so this is pure disinformation. For instance, the article mentions the decision to close high schools, but fails to mention that Sweden had already done so in the Spring.
I don’t agree with everything about Sweden’s strategy to deal with the pandemic. For instance, as someone who has argued that mask-wearing should be encouraged since before it was cool, I think their stance on masks is stupid, although it has started to reverse it. (I say that even though I think masks are clearly not the panacea many people think and that studies about their efficiency are mostly useless garbage. Public health experts and journalists now claim that, although it wasn’t rational to believe that masks helped to reduce transmission back in March, it’s different now because new evidence has come in that show masks to be effective. But if you ask me, this is just a self-serving mythology they created to explain their U-turn on that issue and not look like fools, which is exactly what they are.) But the non-stop lying, biased reporting and double standard that I see every day in the media about what’s going on in Sweden is driving me crazy. I could write a whole book about that, but this isn’t what this post is about. Instead, I want to address the familiar argument that, since the number of COVID-19 deaths per capita is much higher in Sweden than in other Nordic countries, it proves that its strategy was a disaster.
One problem with that argument is that it implicitly assumes that the number of deaths is the only metric that matters here, but as I noted previously, even if every single death caused by the pandemic in Sweden could have been prevented with more restrictions (which is ridiculous), it would just mean that during the first wave ~5,000 mostly old people were allowed to die so that 10 million others could live something much closer to a normal life than anywhere else in Europe for 2 months. It seems to me that, with the benefit of hindsight (I’ll leave the question of whether Sweden’s approach was optimal given how little we knew about the virus in March for another time), this was clearly worth it. But even if you disagree with me on that point, you surely have to agree that it’s at least not obvious that it wasn’t, so it’s really crazy that everyone is talking as if the fact that Sweden’s strategy had been a total disaster wasn’t even something reasonable people can disagree about. It’s just something that everybody says because everybody is saying it, not because they’ve actually thought about it carefully, like everybody was saying in March that people shouldn’t wear masks. (If you ask me, that’s why most people, including so-called experts, say most of the things they say, but that’s another issue.) But in this post I want to focus on the outcome that people who make this argument focus on at the exclusion of everything else, namely how many people died of COVID-19 in Sweden and to what extent it was the result of the country’s decision not to go on lockdown.
I’ve already explained in my previous post why the argument that we should only compare Sweden to its neighbors is confused:
Speaking of confused arguments, many people claim that, since Sweden’s neighbors only had a fraction of the deaths it did, most of the deaths in Sweden could have been prevented with a lockdown. Of course, you would reach a completely different conclusion if you compared Sweden to some other countries, such as Spain, that recorded more deaths per capita despite having a lockdown. But people argue that we should only compare Sweden to its neighbors, because they have a similar culture, so they provide the best counterfactual. However, this argument is totally unconvincing, because in any country the epidemic is affected by countless factors and we don’t have a very good idea of what most of them are. Culture is probably one of them, but it’s not the only one and almost certainly not the main one. We also don’t know exactly what aspects of culture matter. It could be that, although overall Sweden is culturally closer to other Nordic countries, it’s actually closer to other European countries with respect to the cultural factors that matter the most for the pandemic. So we are in no position to claim that other Nordic countries provide the best comparison. This is a very basic and obviously correct methodological point, I don’t think it would be remotely controversial if Sweden had not become such a fixation in the debate about the best policy response to the pandemic, but unfortunately it has and that’s why I see people who teach causal inference professionally make this argument all the time.
I don’t really have anything to add on the methodological issue, because I think what I said in this passage is just right and I don’t know what else I could say to convince you if this wasn’t enough. But I think there is more I can say about the substantive issue and, if you weren’t convinced by the methodological point I made above, then perhaps this will convince you.
It’s true that, even if I’m right about the methodological issue, it just means that we have no good reason to think that Sweden’s neighbors provide a better counterfactual for what would have happened if Sweden had adopted a stricter policy to contain the epidemic than other countries. It could still be that, although we are not in a position to know that, Sweden’s neighbors do in fact provide a better counterfactual than other countries and most COVID-19 deaths in Sweden would have been avoided if the country had adopted the same policy as them to deal with the pandemic. But I don’t think it’s true and I think I can show that. In my previous post, I briefly explained what I think actually happened:
All European countries implemented their interventions around the same time, but for whatever reasons (which had nothing to do with policy), the epidemic just happened to be more advanced in some countries than others by the time this happened and as a result more people died over there. If more people died in Sweden than in other Nordic countries, it’s not just because there was more “dry tinder” and the government adopted a more relaxed policy in Sweden, but probably also because other countries were lucky that, by the time interventions were implemented and people started to change their behavior as they realized the danger, the epidemic was still at a relatively early stage.
In other words, if Sweden had more COVID-19 deaths than its neighbors, it’s not so much because it decided not to go on lockdown, but mostly because, by the time people realized that the pandemic had reached Europe and governments started to act, for whatever reasons, the epidemic was already more advanced in Sweden than in other Nordic countries.
At the time, I didn’t present any evidence in favor of that hypothesis, because I wanted to focus on my critique of Flaxman et al.’s paper, so many people who otherwise were convinced by this critique understandably remained unconvinced by this particular claim. But I believe there is a very strong case for this hypothesis and, moreover, I think it’s pretty easy to make. In fact, it’s so easy that I’m surprised that, as far I know, nobody has made this argument before. The problem if you’re trying to figure out how advanced the epidemic was by the time Sweden’s neighbors went on lockdown is that data on cases were extremely unreliable because testing was haphazard and different countries had very different testing policies, making international comparisons essentially meaningless. But we now have data on deaths for the whole Spring and, while they’re also far from perfect, they are still far better than data on cases. Moreover, although this is a difficult exercise and it can only be done imperfectly, it’s also possible to estimate the distribution of the infection-to-death delay. Thus, since we know how many people died on each day, if we assume a particular IFR, we can infer how many people were infected on each day by working backward from deaths and therefore we can reconstruct the infections curve. Actually, it’s a little bit more complicated than that, but those complications don’t really make any difference in the end anyway so I’ll ignore them for the moment.
Here is what I did exactly. (If you want to check my code, I uploaded it on GitHub.) On each day, for each COVID-19 death, I drew a likely date of infection from the infection-to-death distribution, which I assumed to be log-normal with log scale mean of 3.19 and log scale standard deviation of 0.44. This corresponds to a mean of 26.8 days and a standard deviation of 12.4 days. I found that estimate, which is based on confidential British data, in this paper. (Incidentally, I haven’t had time to read the technical appendix carefully yet, but it seems very interesting. Doing the same thing as me, but in a more rigorous way, the author found that infections started to decline in the UK before the lockdown started. He did the same thing with Sweden and found that infections peaked around the same time as me despite using better methods. Even though it was submitted to arXiv on May 5 and it’s already been revised 4 times since then, this paper still hasn’t been published in a journal, while garbage like Flaxman et al.’s paper was accepted in Nature back in May. So if you thought the peer review process wasn’t hopelessly biased, you should think again.) I then drew a likely number of infections that occurred on that day from the geometric distribution with a probability equal to the IFR that I assumed to be 1%. (Since ultimately I just want to compare Sweden to its neighbors, it doesn’t really matter what assumption I make about that as long as the IFR was approximately the same in Nordic countries, which presumably was the case.) The geometric distribution just tells you how many infections you need before one of them eventually proves fatal if the IFR is 1%, so on average that number will be 
Thus, for each death in the data, I attributed a number of infections on a particular date. I just need to add the infections from each batch and I obtain the number of infections that occurred on each day according to this simulation. I repeat this simulation 100,000 times for each country in order to get uncertainty estimates. The idea is that both the infection-to-death delay and the size of batches of infections I ascribe to each death are subject to random variation, but we’re not going to capture that if we just use the means of their respective distributions. Of course, we don’t know how this randomness played out in reality, but we can get a sense of the uncertainty by repeating the simulation enough times and looking at the range of epidemics we obtained. If I wanted to sound intelligent, I would say that I used a Monte Carlo approach to infer the number of infections from the data of deaths, but that’s just a fancy way of saying the same thing. To be clear, although it can be made to sound very sophisticated by using this kind of fancy words, at the end of the day, it’s still a quick and dirty approach and I’m sure one could do much better. But as I argue below, it’s probably good enough for the point I want to make, so it doesn’t really matter. Beside, many papers have been published despite using even cruder methods, so I’m not going to feel bad about it.
Anyway, enough with the methodology, I know most of you just want to see the results so here they are: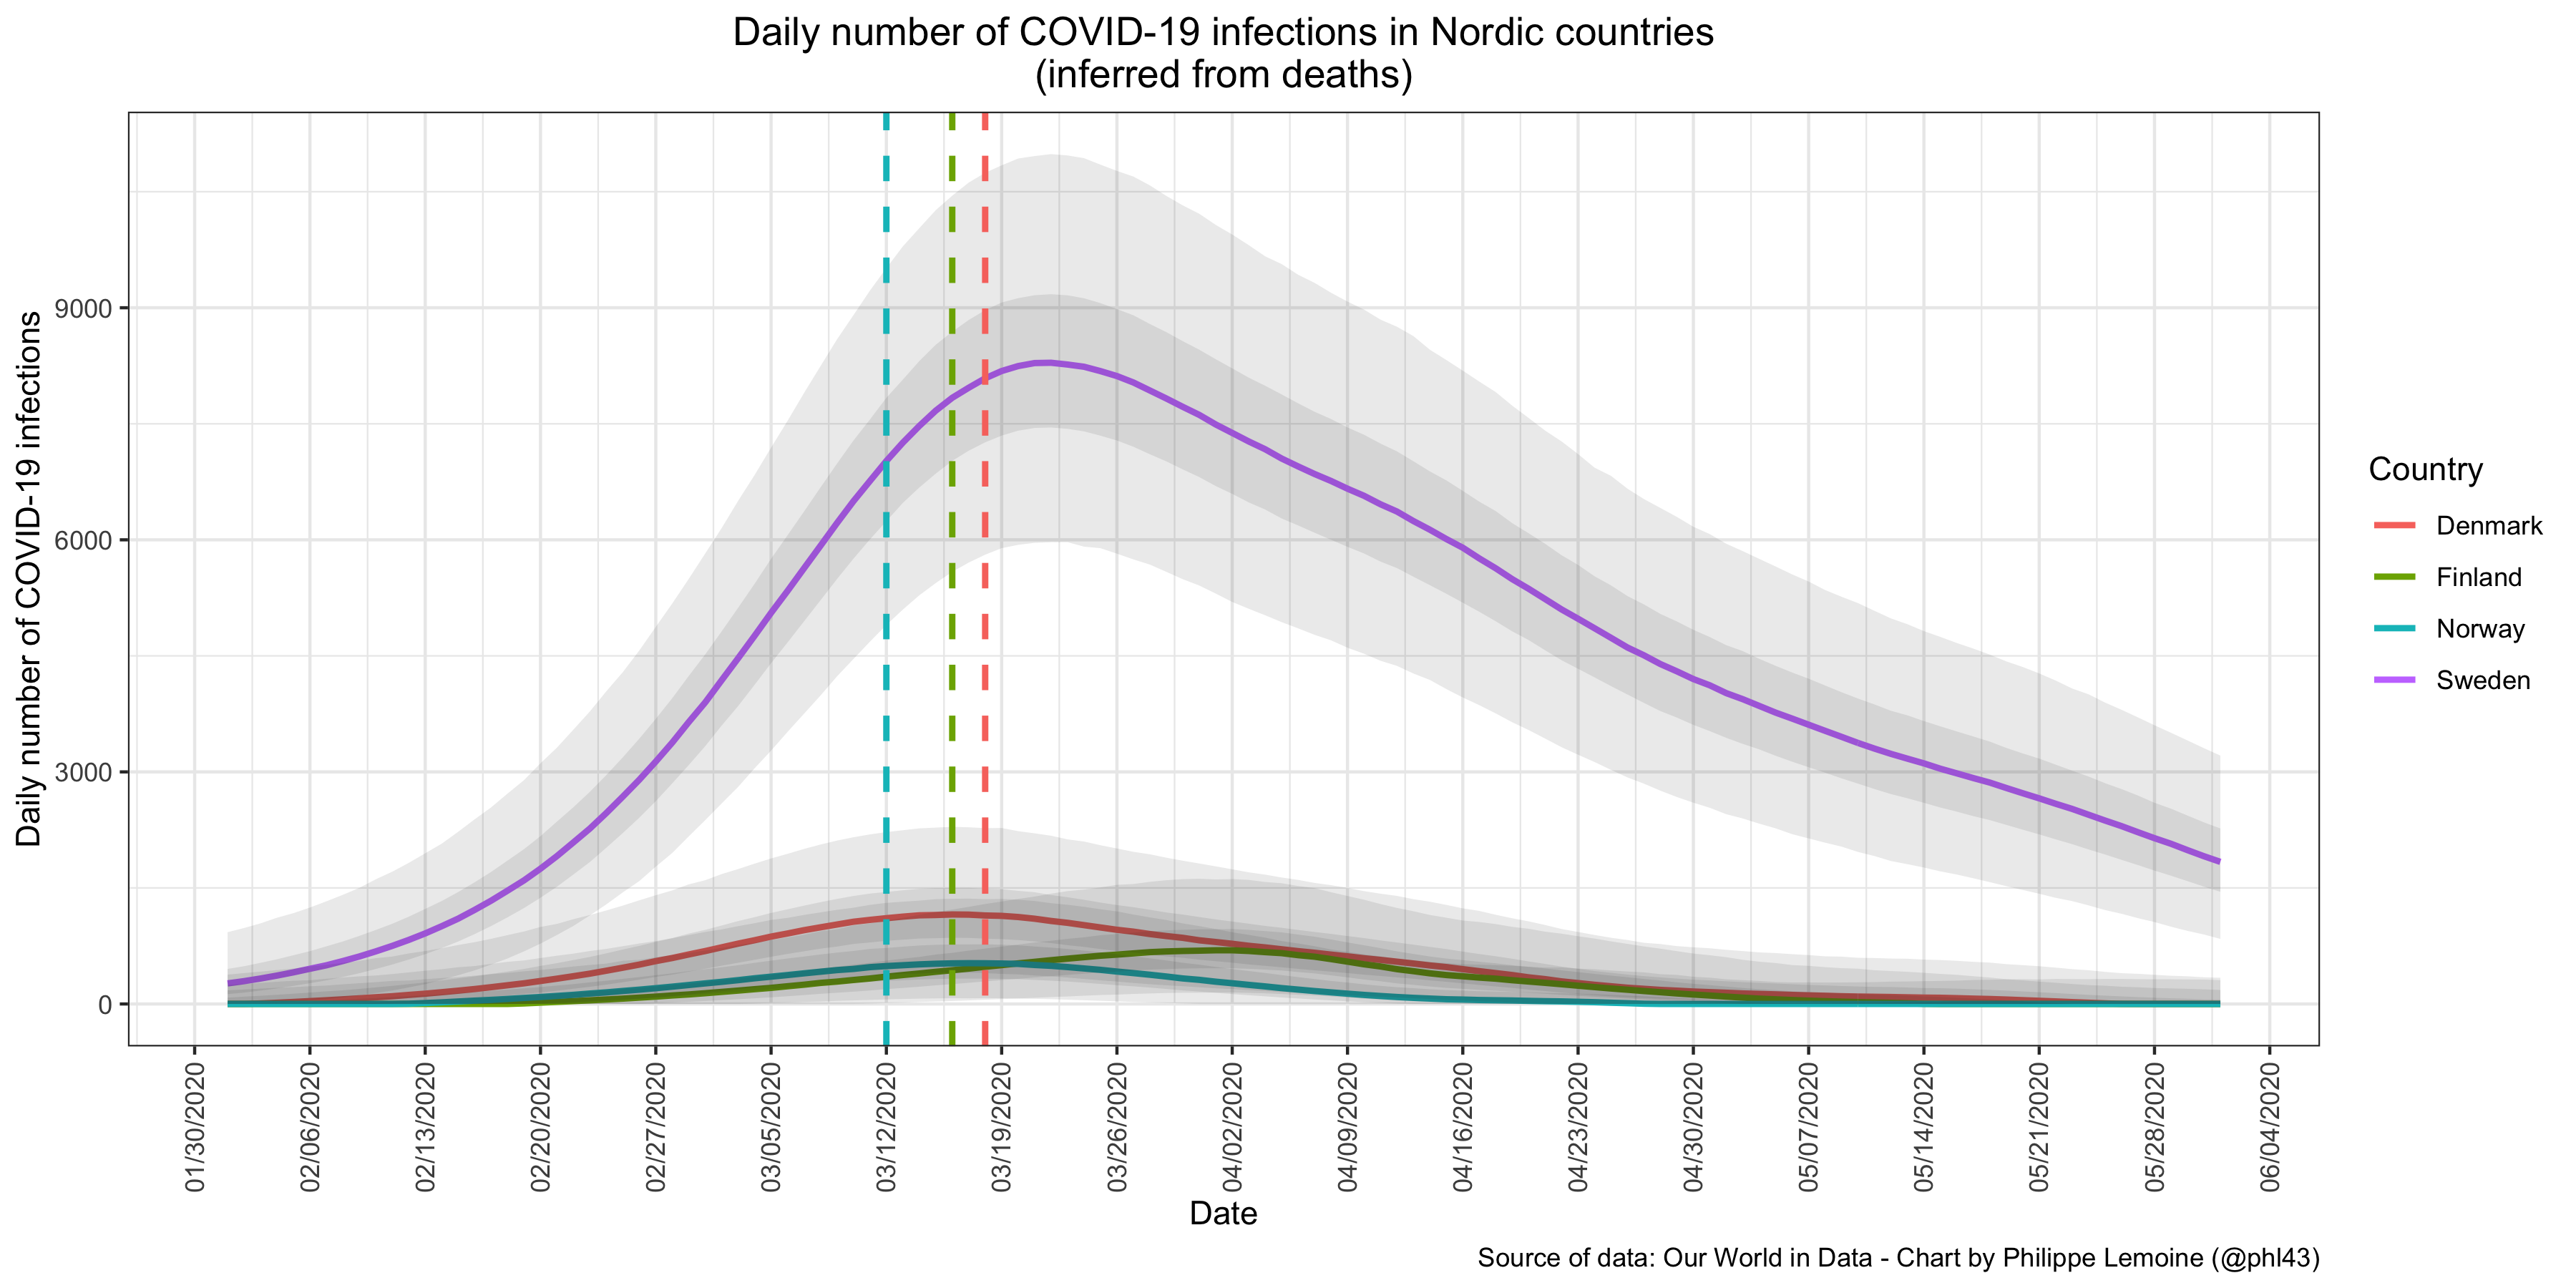 In order to represent uncertainty, I added dark gray bands that show the range of estimates for 50% of the simulations, as well as light grey bands showing the range that contains the estimates for 95% of the simulations. I also added dashed vertical line that show when Denmark, Finland and Norway went on lockdown.
As you can see, by the time other Nordic countries decided to go on lockdown, the epidemic was already far more advanced in Sweden. To be more specific, if I look at the median number of infections for each country in my simulations, on the day before Denmark went on lockdown, there were almost 7 times more infections in Sweden than in Denmark. On the day before Finland went on lockdown, there were more than 18 times more infections in Sweden than in Finland. Finally, on the day before Norway went on lockdown, there were more than 14 times more infections in Sweden than in Norway. To be clear, I wouldn’t take those estimates very seriously, since I did that very quickly and you would get different estimates with another model. Indeed, as I explained in my post on Flaxman et al.’s paper, you can infer epidemic trajectories that are completely different but nevertheless fit the data more or less equally well. However, I tried a pretty wide range of parameters for the infection-to-death distribution and the results are extremely robust, so at least it’s not sensitive to reasonable changes in the values of the parameters. Another reason why you shouldn’t take the specific estimates I found very seriously is that apparently Sweden reports death by date of death whereas the other Nordic countries report them by date of report, so the infections curve I inferred for Denmark, Finland and Norway should be shifted to the left somewhat. However, you just have to take a look at the chart above to see that it wouldn’t have changed much, because the infections curves never reached very high in other Nordic countries and they were already close to their peak by the time they went on lockdown even when you don’t correct for the reporting delay.
I think on any reasonable model, you’re going to reach the same conclusion, namely that for whatever reasons the epidemic was already far more advanced in Sweden than in other Nordic countries by the time they went on lockdown. If you think that’s not true, then you’re welcome to make your own model and show it, but I don’t think it’s going to happen. Even Flaxman et al.’s ridiculous model finds that Sweden had slightly less infections than Denmark just before the latter went on lockdown and far more than Norway right before it did. For some reason, they didn’t include Finland in their study, but presumably it would have looked like Norway. This is pretty remarkable because, since their model assumes that lockdowns instantly reduced transmission and that nothing else did, it could only be made to fit the data by inferring a rapid and massive build-up of infections in the days before the lockdown, so that’s pretty much the worst case scenario for my hypothesis and yet it still comes out looking pretty good except when you compare Sweden to Denmark. But I want to reiterate that not only is Flaxman et al.’s model the worst case scenario for me, since by construction it’s going to infer that most of the infections in a country occurred right before the lockdown, but it also rests on several totally implausible assumptions, so again I’m pretty confident that on any reasonable model you will reach the same conclusion I did with my quick and dirty approach.
So again here is what I think actually happened. For whatever reasons, by the time Nordic countries other than Sweden went on lockdown, there was already way more infections in Sweden. This may have had something to do with the fact that Sweden is a larger economy, so it was seeded earlier because there is more international traffic, but it could also have just been chance. Indeed, we know that stochastic factors play a big role early in the epidemic, so there may not be any systematic explanation. For instance, Italy was affected much earlier than the United Kingdom, but it’s not because it’s a larger economy with more international traffic, which it’s not. Anyway, I don’t know why the pandemic hit Sweden earlier, but it clearly did and presumably this had nothing to do with policy (it certainly had nothing to do with the government’s decision not to go on lockdown in March), since this played out before any European government, including Sweden’s neighbors, took any drastic actions to contain the epidemic. After restrictions were implemented and people’s behavior started to change, the reproduction number was quickly pushed below 1 both in Sweden and in other Nordic countries so incidence fell rapidly, but it started from a much higher level in Sweden so it took longer to fall.
Transmission was probably cut a bit faster in other Nordic countries than in Sweden because they imposed more stringent restrictions, but as I noted in my previous post, you just have to eyeball the deaths curve in Sweden and compare it to that in other European countries that went on lockdown to see that the difference probably wasn’t dramatic. (Another reason is that Sweden waited until March 29 to ban events with more than 50 people, which was pretty late compared to other countries. As I said above, I don’t agree with everything Sweden did. I already mentioned their stance on masks, but this is another example of something I think was a mistake, because I think it’s clear they should have banned public events much sooner.) However, even if Sweden had gone on lockdown at the same time its neighbors did, there would still have been significantly more COVID-19 deaths in Sweden than in other Nordic countries just because, by the time restrictions imposed by the government and people’s changes in behavior started to cut transmission, Sweden was already swimming in virus whereas its neighbors weren’t. What people call the Swedish disaster, which as I noted above would be ridiculous even if they were right about what caused the heavier death toll in Sweden, was already baked into the cake before any country in Europe went on lockdown.
But maybe you’re not totally convinced yet. Indeed, I just showed that by the time its neighbors went on lockdown, the epidemic was already far more advanced in Sweden. This no doubt means that, even if the Swedish government had decided to put the country in lockdown, there would still have been more COVID-19 deaths in Sweden than in other Nordic countries, but can it really explain most of the difference? After all, by the beginning of July, the cumulative number of COVID-19 deaths in Sweden was more than 9 times higher than in Denmark, almost 17 times higher than in Finland and 22 times higher than in Norway. You may think that, although Sweden was bound to have a higher COVID-19 mortality than its neighbors because incidence had already reached a much higher level by the time they decided to go on lockdown, had it done the same thing, it would have cut transmission very quickly and this would have been enough to save most people who died of COVID-19 in Sweden. As I explained in my post on Flaxman et al.’s paper, the evidence doesn’t support the view that lockdowns immediately reduce the reproduction number in that way and, while it’s likely that a country will reduce it somewhat more quickly with a lockdown, once less stringent restrictions have already been implemented, it doesn’t seem that a lockdown adds much. (I know that many people still don’t believe that, but I think the evidence for that claim is pretty overwhelming, so I’ll probably revisit this question in another post.) But it doesn’t really matter because it’s easy to show that, even if lockdowns did massively reduce transmission as soon they come into effect and Sweden had gone on lockdown around the time its neighbors did, it already had such a head start at this point that it would ended up with a much higher COVID-19 mortality.
In order to do so, here is what I did. As I explained above, by working backward from deaths, we can infer the number of infections that occurred on each day. So what I did is just simulate a counterfactual in which the epidemic unfold as it did in reality, as inferred with the method I described above, until March 15 (around the time Sweden’s neighbors actually went on lockdown), when I assume that a lockdown came into effect in every Nordic country including Sweden and instantly reduced the reproduction number to 0.6 where it stayed afterward. To be clear, nobody seriously believes that a lockdown would have immediately reduced transmission in Sweden to such a low level, nor that it did so in the other Nordic countries that actually went on lockdown around that time. It’s what Flaxman et al. assumed in their model, but even them know that it’s not a realistic assumption. I only make that assumption to show to what extent the fact that, by the time other Nordic countries went on lockdown, the epidemic was already far more advanced in Sweden can explain the higher COVID-19 death toll in that country during the first wave. If I can show that, even when I make this assumption to simulate the counterfactual, most of the difference in COVID-19 mortality between Sweden and its neighbors in that counterfactual can be explained by this fact, then a fortiori it should convince you that it explains most of the difference in the actual world.
In order to simulate infections after March 15, I used a discrete renewal process that assumes the generation time, i. e. the delay between the time someone is infected and infects someone else, follows the distribution estimated in this paper. (There may be a better estimation out there, I didn’t spend much time looking for one, but it’s still better than what Flaxman et al. did. Indeed, they used the serial interval to simulate infections, but as the paper I just cited shows, this can be misleading. In any case, for my purposes here, I don’t think using another estimate of the generation time would make any meaningful difference.) It’s just a fancy way to say that, for each infection that I have already inferred, I draw a delay from the generation time distribution and, if after this delay the date is March 15 or later, I add 0.6 infections to that date, which is how I obtain the number of infections for each day after the lockdown comes into effect. Finally, in order to simulate deaths in the counterfactual, I just did the same thing I did to infer the number of infections from deaths, except that I worked forward instead of backward. Thus, for each infection, I randomly determine whether it will be fatal by simulating a Bernoulli trial with a probability of 1%. Then, if the infection has been determined to be fatal, I randomly draw a delay from the infection-to-death distribution and I add one death to the day corresponding to that delay. I repeat the whole simulation, inferring the infections that occurred before March 15 from the deaths that were actually observed then simulating how the epidemic would have unfolded if a lockdown had suddenly pushed the reproduction number to 0.6 on that day and it had stayed there after that, 100,000 times to be able to compute uncertainty estimates.
Anyway, the exercise is pretty straightforward and I don’t think I need to dwell on the methods, so let’s just have a look at the results: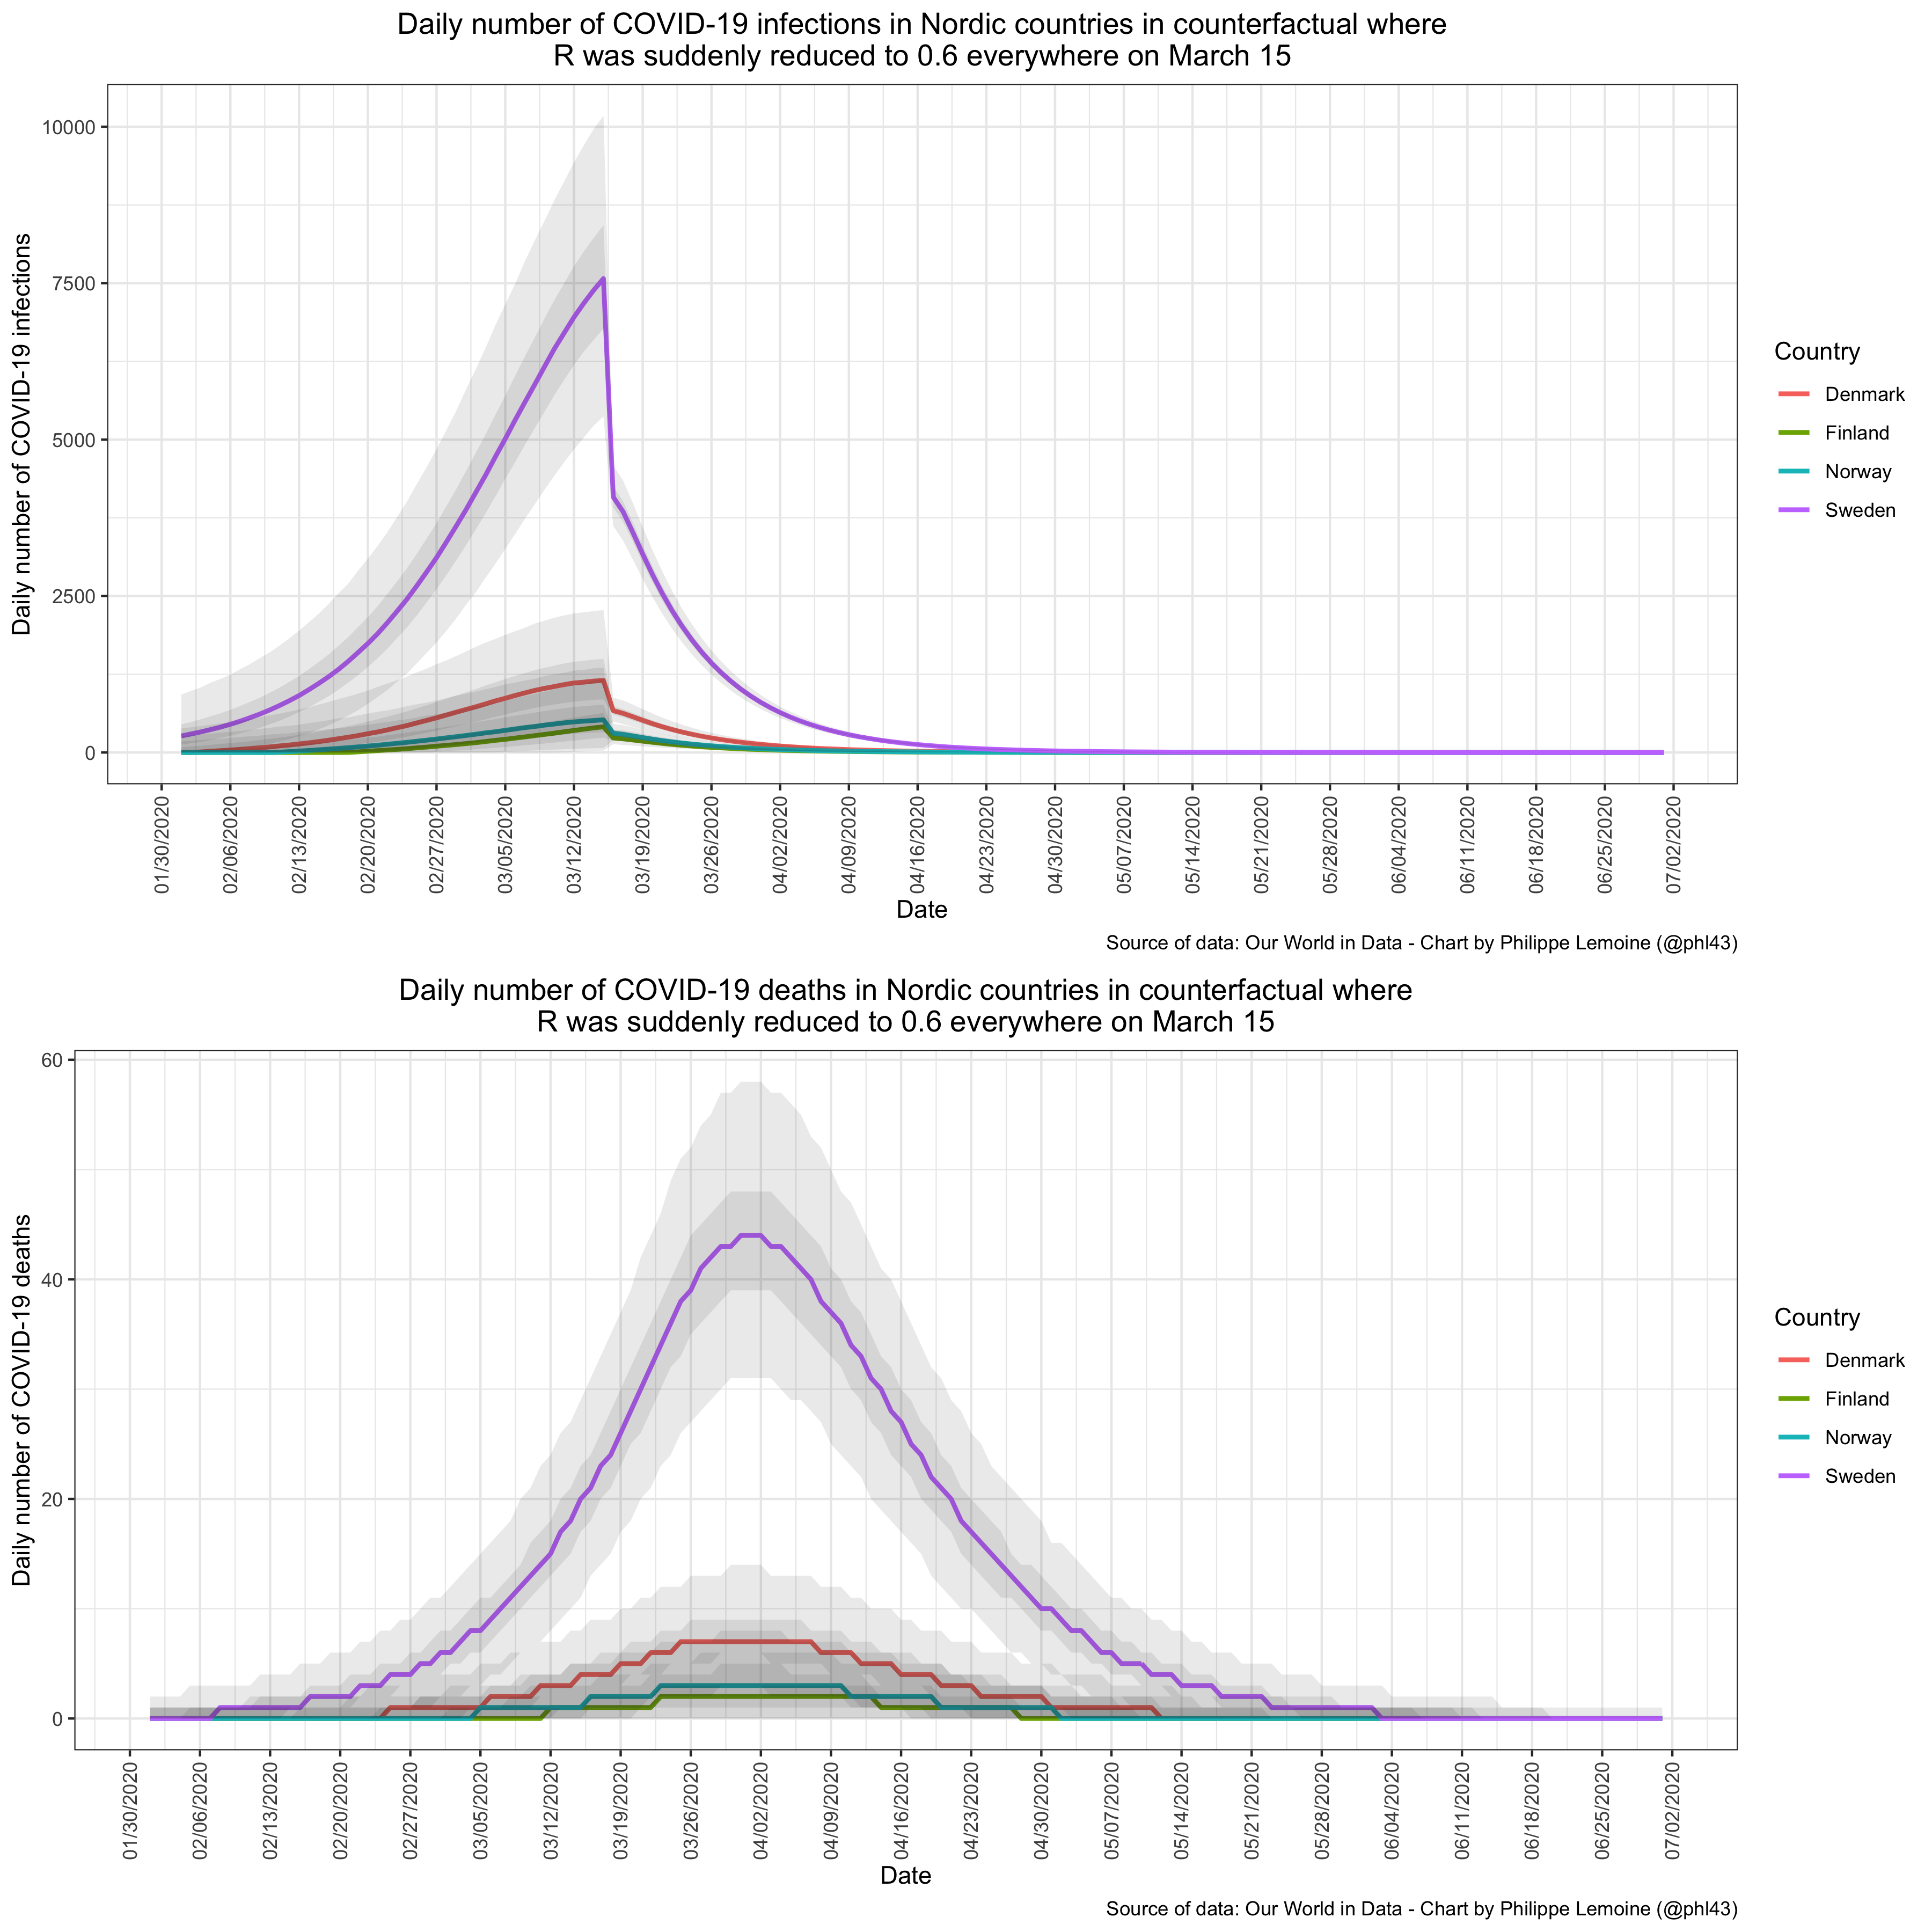 Unsurprisingly, if you compare the deaths curves on this chart to the actual deaths curves in Nordic countries, you will notice that the peaks are much lower, they are reached earlier and the curves are almost symmetric whereas the actual deaths curves are heavily right-skewed. That’s because in reality transmission wasn’t cut so rapidly either in Sweden where there was no lockdown or in other Nordic countries where there was. Indeed, if you look at the upper part of the chart, you will see that, in this counterfactual, the number of infections fell suddenly on March 15 and then continued to fall rapidly until it reached zero.
But what is relevant for the discussion is that, although the simulation assumes that transmission is reduced immediately to 0.6 on March 15 in all countries, the cumulative number of deaths still ends up being much higher in Sweden because, by the time the lockdown came into effect, there was far more people who had already been infected in Sweden than in other Nordic countries. To be specific, if I take the median of the simulations, the cumulative number of deaths is more than 6 times higher in Sweden than in Denmark, almost 25 times higher than in Finland and more than 15 times higher than in Norway. (I tried a wide range of different values for the final reproduction number and it doesn’t meaningfully affect the conclusion.) In other words, even though I have assumed that Sweden went on lockdown in this counterfactual and that it was far more effective at reducing transmission than it would realistically have been if Sweden actually had made that decision, the extent to which the cumulative number of deaths in Sweden is higher than in other Nordic countries is very similar to what has actually been observed. This shows that Sweden’s higher COVID-19 death toll was already inevitable by the time its neighbors went on lockdown and should put to rest the notion that most of the difference was the result of the Swedish government’s failure to order a lockdown. Of course, the infections up to March 15 were imprecisely estimated and you would no doubt get somewhat different results with another model, but I don’t believe the overall conclusion would be meaningfully different on any reasonable model.
I’m not saying that policy had no effect whatsoever, but it was almost certainly not the main factor. This is even more obvious if the “dry tinder” theory is true, but even if it is, it’s clearly not the main explanation in my opinion. The main explanation is that, for whatever reasons, by the time other Nordic countries went on lockdown, there were already far more deaths in the pipeline in Sweden. As I noted in my previous post, although Sweden’s government imposed far less stringent restrictions, it doesn’t seem that it made a huge difference to how quickly transmission was reduced. Relatedly, you may have been surprised by the fact that, in the counterfactual, the cumulative number of deaths is lower in Finland than in Norway, even though in reality it was significantly higher. If you go back to the chart that shows the infections curve in Finland that I inferred from deaths, the reason is not difficult to understand. Indeed, according to this chart, infections didn’t peak in Finland until the beginning of April even though a lockdown had come into effect on March 16. Thus, since in the counterfactual I assumed that a lockdown came into effect on March 15 and suddenly cut reduced the reproduction number to 0.6, incidence peaked much sooner than it did in reality and consequently the eventual death toll was lower than in Norway, where the peak of infections actually seems to have been reached around March 15. Even accounting for the fact that, as I noted above, Nordic countries other than Sweden report deaths by date of report so the infections curve I inferred should be shifted to the left somewhat, the fact that infections seem to have peaked in Finland so long after the lockdown is hard to reconcile with the view that lockdowns reduce transmission massively and rapidly.
To be clear, although I think there is no doubt that far more people had already been infected in Sweden than in other Nordic countries by the time interventions started and people’s behavior began to change, I don’t claim that it’s the only explanation for why the death toll of the first wave was so much larger in Sweden. In particular, it’s possible and even likely that, had Sweden gone on lockdown in March, some deaths would have been averted. But it’s clearly not the main explanation for the disparity between Sweden and its neighbors. The fact that far more people had already been infected in Sweden by the time other Nordic countries went on lockdown is sufficient to explain most of that disparity. I also don’t claim that, if the epidemic was already far more advanced in Sweden than in other Nordic countries by mid-March, it’s just for purely stochastic reasons. I don’t know why more people had already been infected in Sweden by that time, but there could also be structural factors that make Sweden a more favorable ground for the virus to spread, even if we don’t know what they are.
Indeed, even right now during the second wave, although this may not last, incidence has reached much higher levels in Sweden than in at least some of its neighbors and in this case it can’t be explained by timing. (The number of new cases per capita was higher in Denmark than in Sweden last week and it has been increasing extremely fast, though I think Denmark is testing more so it’s hard to make a comparison, but it remains much lower in Finland and Norway.) However, despite what many people seem to think it probably doesn’t have much to do with policy either, since other Nordic countries have been doing pretty much the same thing as Sweden for several months now and indeed the restrictions over there have arguably been less stringent than in Sweden. Moreover, judging from deaths, incidence in Sweden had fallen to a level comparable to that of its neighbors by mid-Summer, so it’s not also path-dependence caused by what happened during the first wave. I think a hugely under-appreciated fact is how much unexplained heterogeneity there is.
For some reasons we don’t understand, some countries are much more affected than others, but people have already set their mind on a simplistic narrative so they just ignore every data point that doesn’t square with it. In particular, pro-lockdown advocates have decided that any between-country differences must be the result of policy, even though when you look at the data without cherry-picking I think it’s really not easy to pick up the effect of policy, so they’re always ready with just-so stories to explain any between-country difference that doesn’t seem to fit with this narrative by tying it to a difference in policy, real or imaginary. For instance, if Germany had avoided a high death rate, it was supposed to be thanks to the amazing way in which it had handled the pandemic, until shit hit the fan recently and now we don’t hear about how lucky the Germans are to have someone like Merkel who believes in science at the help anymore. Meanwhile, Serbia eventually managed to break the second wave by doing essentially the same thing as Sweden in the Spring, but you don’t hear any pro-lockdown advocates talk about it. Until cases start going back up again, which they probably will, at which point they’ll start talking about Serbia and use it as a cautionary tale for what happens if you don’t lock down. Even when the policy differences they use to explain everything actually exists, which they often don’t, there is no way to show it’s actually the explanation of the difference in outcomes, but it doesn’t matter because they’re already convinced that policy is the main factor. This has been a major problem in the COVID-19 discourse since the beginning, some of you may remember that I was already making that point in March (back when I was pro-lockdown), but as I was noting more recently it has only gotten worse with time. Even in the same country, we often see changes in incidence that we just can’t explain, but since people don’t like uncertainty and the whole issue has become politicized everybody just ignores that. But this is a story for another time.
What I wanted to show in this post is that, although it’s true that Sweden had far more COVID-19 deaths than its neighbors, the difference probably has little to do with policy. While there may be structural factors that allow the virus to spread more in Sweden, during the first wave, timing alone can explain most of the difference between Sweden and its neighbors. In order to reach this conclusion, I didn’t use very sophisticated methods, but I don’t think it should make you doubt the conclusion. When the results are qualitatively so clear-cut and robust to changes in the model’s parameters, I put more trust in a simple model with only a handful of parameters that can be estimated from data than in a more complex model with dozens or even hundreds of parameters, such as ICL’s agent-based model, that researchers just pull out of their ass because they can’t be empirically estimated. If someone nevertheless thinks that I’m wrong, all they have to do is come up with another model that doesn’t make any crazy assumptions and finds something completely different, but I won’t be holding my breath.
The truth is that you don’t need a complicated model to see that the basic story I tell is true, you just have to eyeball a chart that shows the deaths curves for Nordic countries and think about what this means given the range of reasonable estimates for the infection-to-death distribution: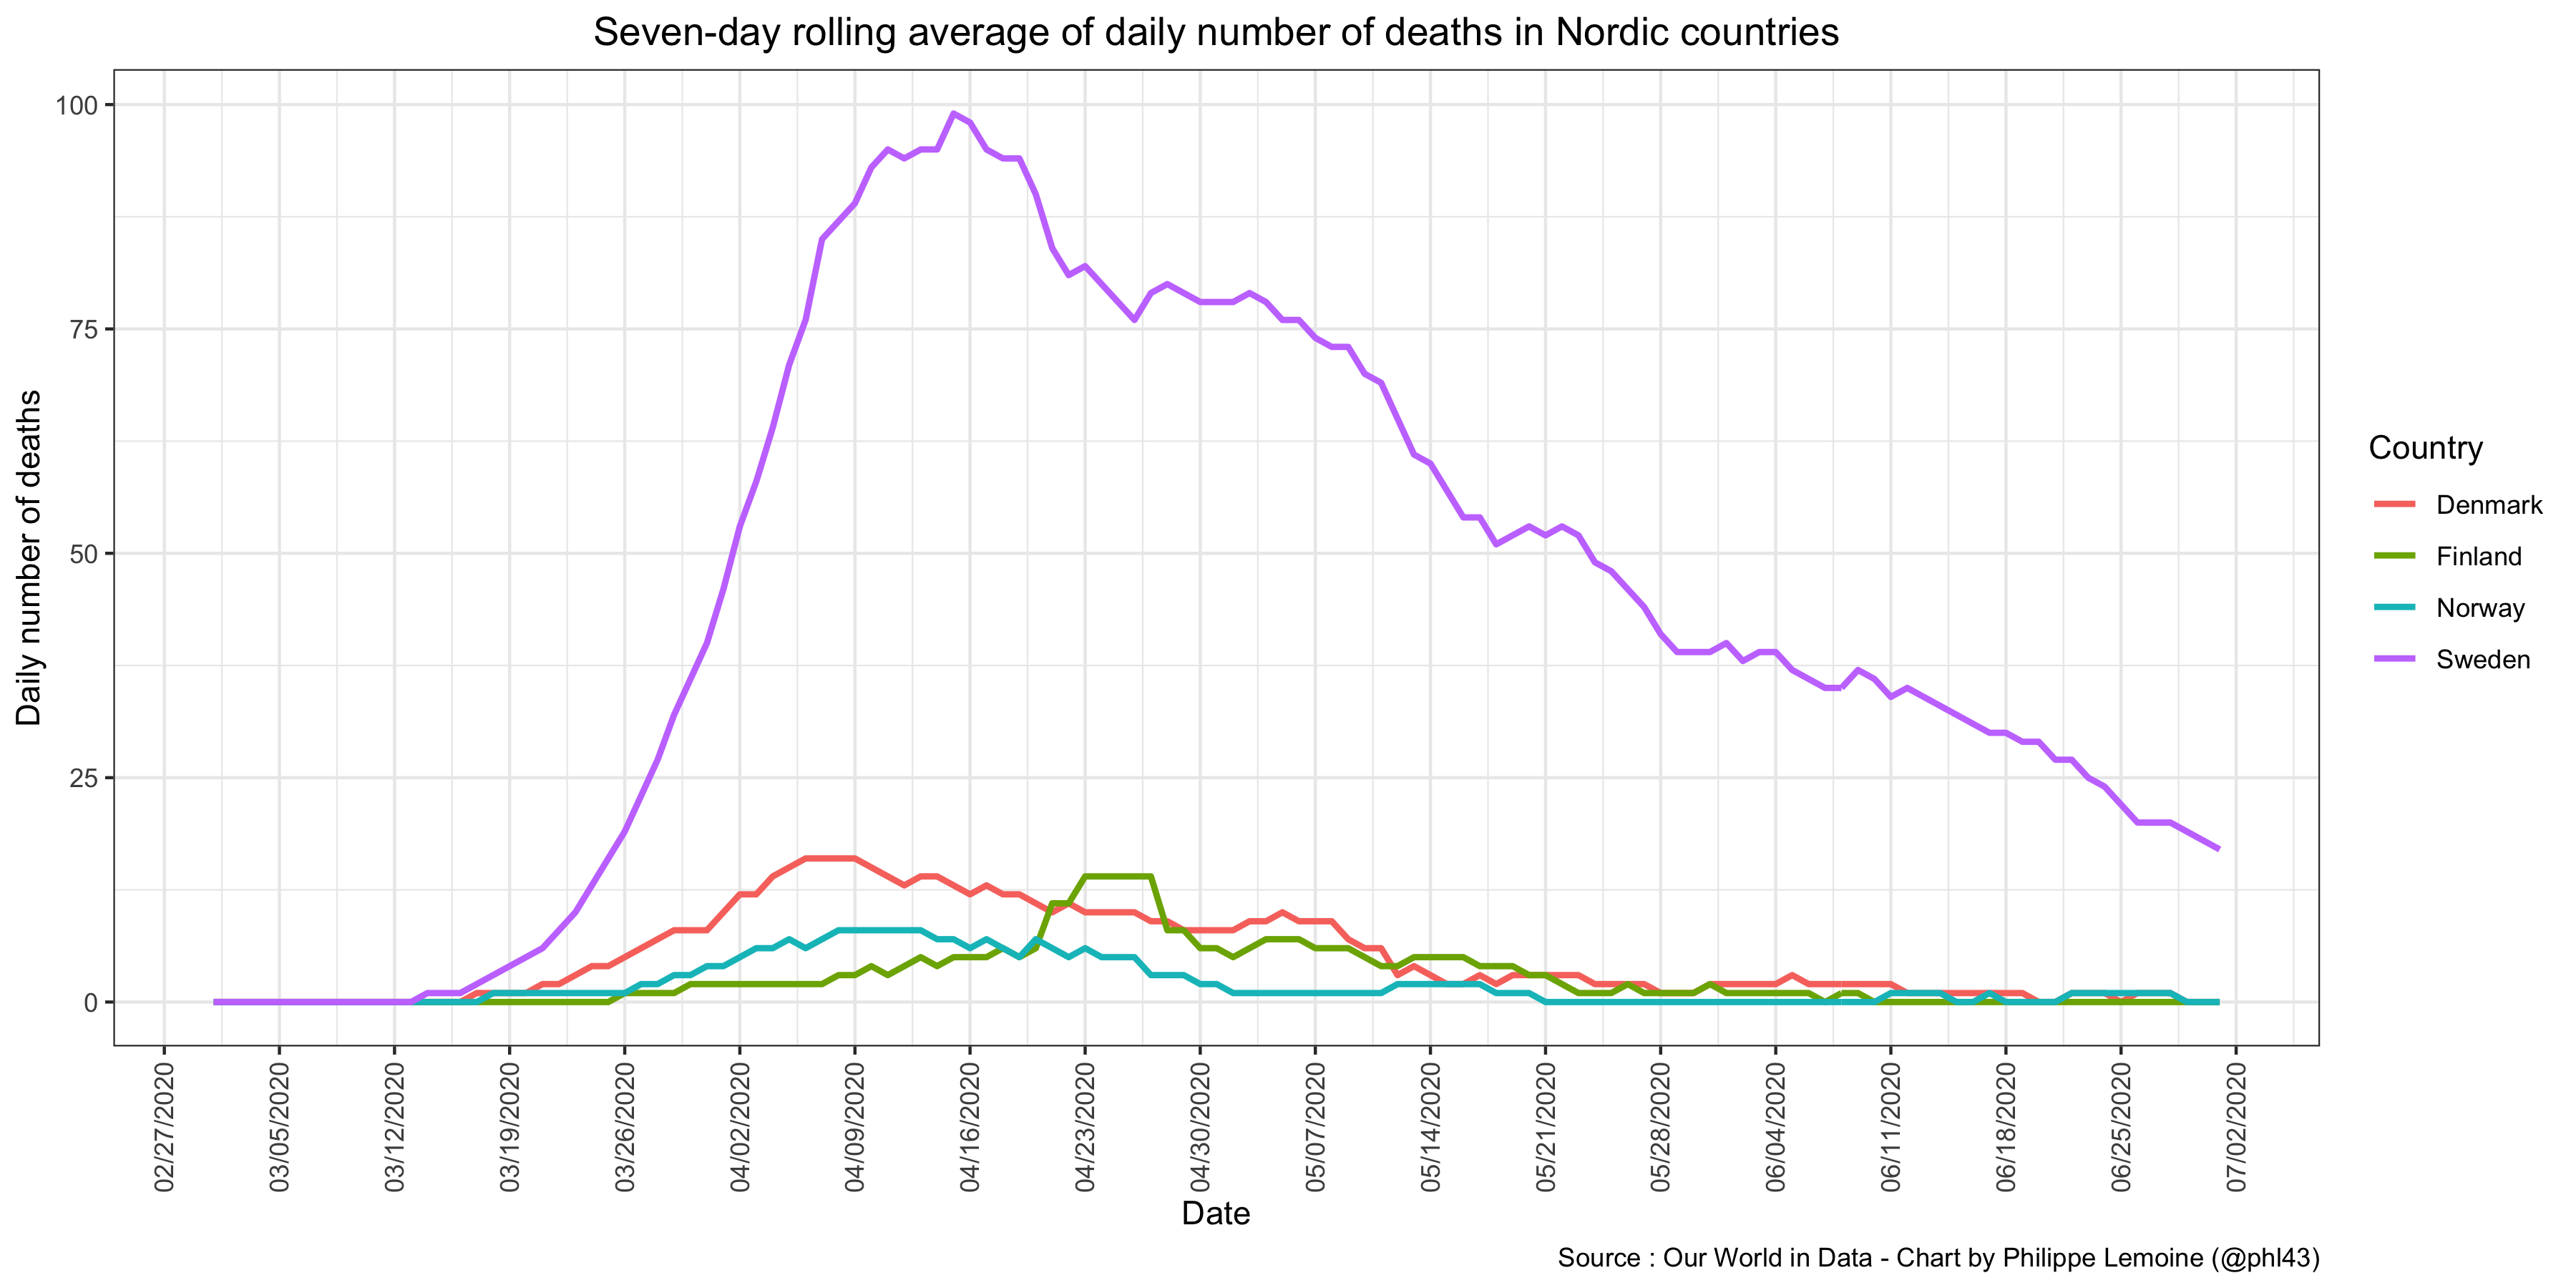 It’s telling that, even though the data have been right in front of them this whole time, this explanation hasn’t occurred to any of the people who constantly make the argument that a comparison between Sweden and its neighbors shows that failing to lock down was a disaster. Confirmation bias is one hell of a drug.
ADDENDUM: To be clear, it’s possible and even likely that, had Sweden locked down sufficiently early, it would have avoided most COVID-19 deaths. But in order to achieve that result, it would have had to go on lockdown very early, earlier than any European country. I don’t think it would be reasonable to criticize the Swedish government on the ground that it failed to do that, even though nobody had a clue that, by early March, things had already gotten so bad in Sweden. Moreover, the data suggest that it could have achieved a very similar results by adopting restrictions much less stringent than a lockdown around the same time, so the failure to lock down was still not the crucial problem. Finally, none of that changes the fact that, despite what critics of Sweden claim, its neighbors don’t provide a good counterfactual, since the epidemic was in a much earlier stage than in Sweden by the time they locked down, which is the main thing I wanted to show in this post.
ANOTHER ADDENDUM: Predictably, many people don’t think the assumptions I made are realistic and claim the results would be different with more realistic assumptions, but they also don’t try to tweak the model and show that even though I provided the code precisely so that people could do that. However, as I noted above, the results of my analysis are very robust to reasonable changes in the parameters of the model. In fact, I think they’re robust even to pretty extreme assumptions, so I wanted to do a quick sensitivity analysis in order to illustrate this point better than I did above. For this sensitivity analysis, I continued to assume that the IFR was 1% in Sweden, but I assumed that it was only 0.5% in other Nordic countries. That’s a pretty large difference and I doubt the real disparity is that large, because Nordic countries have very similar demographic characteristics, but I guess it’s possible. Indeed, if there is some truth to the “dry tinder” hypothesis, then you would expect the IFR to be higher in Sweden. Moreover, to account for the fact that Sweden reports deaths by date of deaths while other Nordic countries report them by date of report, I assumed that the mean of the infection-to-death distribution was ~21 days in Sweden but continued to assume that it was ~26.8 days in other Nordic countries. Frankly, such a difference strikes me as implausibly large, but again I want to err on the side of caution here. Except for those assumptions, I didn’t make any other change to the model.
Okay, without further ado, here is what the model finds when you make those assumptions: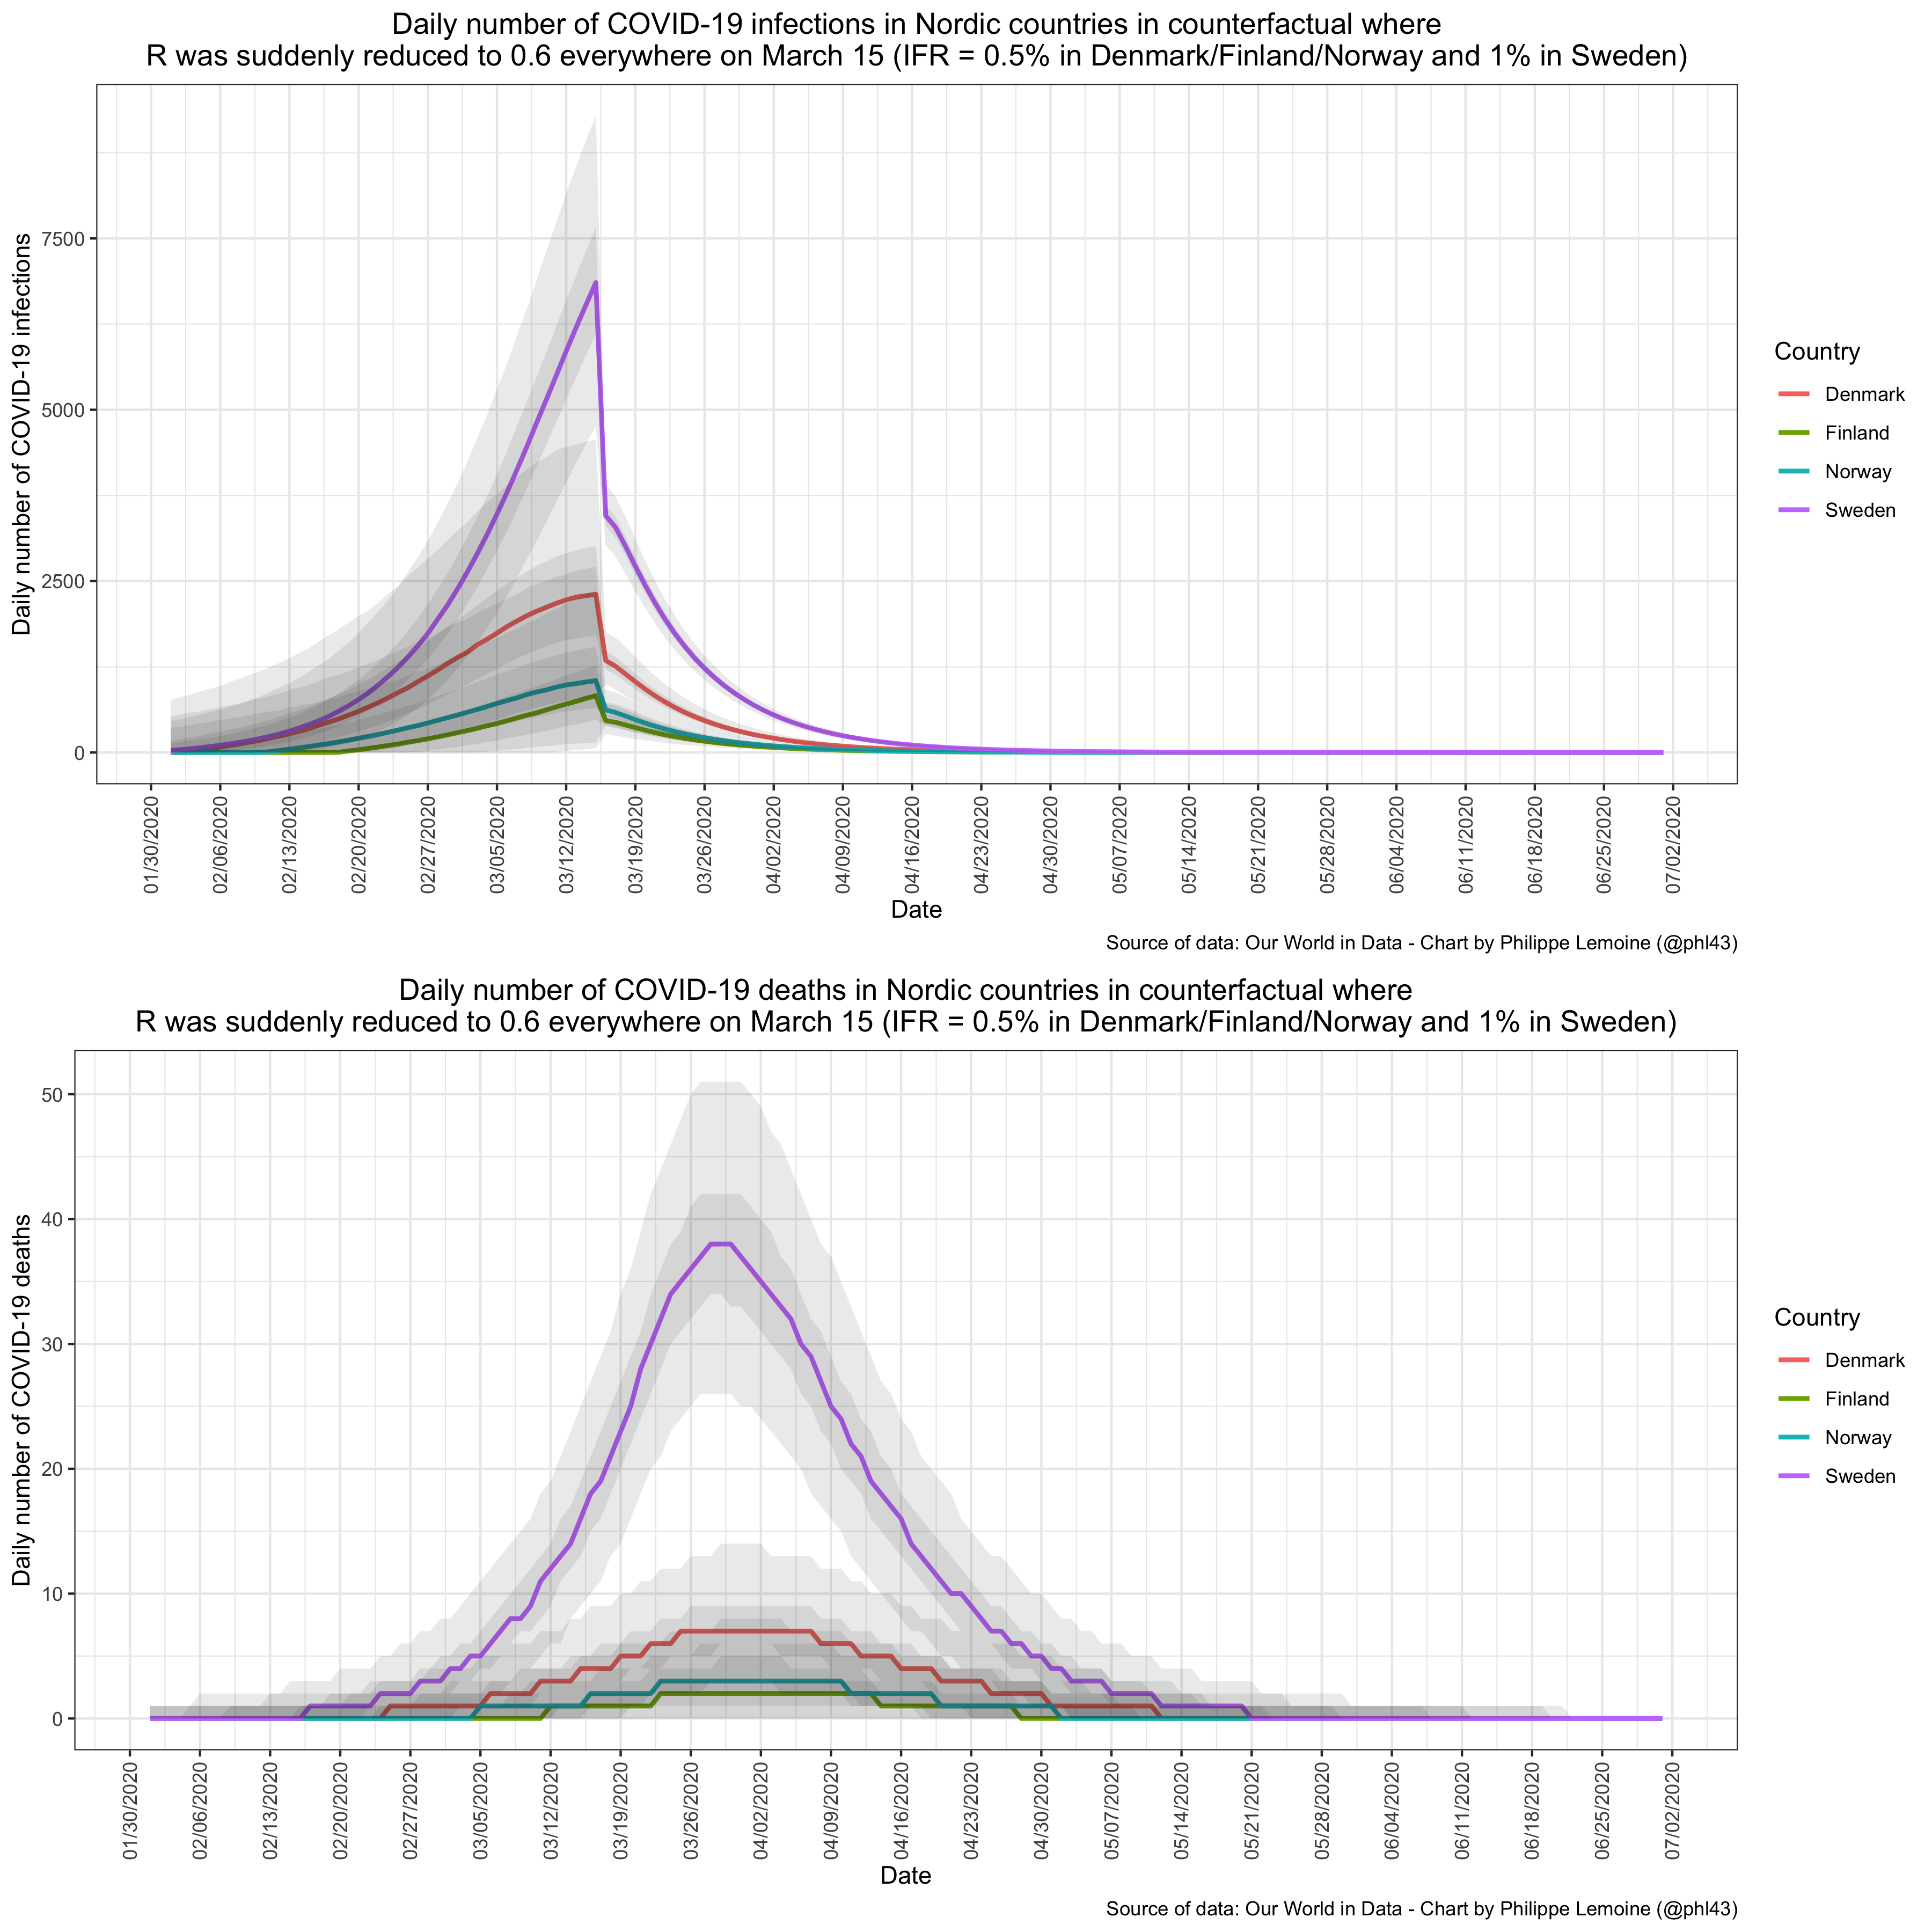 As you can see, even when I make assumptions that are heavily stacked against my hypothesis, the results stay qualitatively similar.
The model still estimates that incidence was much higher in Sweden than in other Nordic countries by the time they went on lockdown, but in the case of Denmark the uncertainty bands overlap, although barely. The cumulative number of deaths in Sweden is ~4.4 times higher than in Denmark, ~17.6 times higher than in Finland and ~10.8 times higher than in Norway. Those ratios are smaller than with the assumptions I made above and smaller than the actually observed ratios, but they’re still almost 50% of the latter in the case of Denmark/Norway and equal to the actual ratio in the case of Finland. Perhaps more importantly, even under those assumptions, the number of COVID-19 deaths per capita is still much higher in Sweden than in other Nordic countries. Keep in mind that it’s what the model finds when I assume not only that Sweden did a lockdown but that it was incredibly effective, far more than anyone can reasonably think it would have been, so in all likelihood the ratios would have been even larger if Sweden had locked down. If you want to tweak the model in a different way, I made the code available and you can change any parameters of the model in one line of code, so I made it as easy as possible for you to show that my results are not robust to reasonable changes in the value of the parameters. Note that even if you could show that, it would only mean that my conclusion is not as robust as I thought, but I would still have shown that, under a pretty wide range of assumptions, a simple though reasonable model finds that Sweden’s neighbors don’t provide a good counterfactual for what would have happened if the country had locked down around the time they did.
YET ANOTHER ADDENDUM: Some people have told me they think the IFR should be even lower in Finland and Norway, so here are the results of another sensitivity analysis where I made the same assumptions as previously but assumed that the IFR was 0.5% in Denmark, 0.2% in Finland/Norway and 1% in Sweden: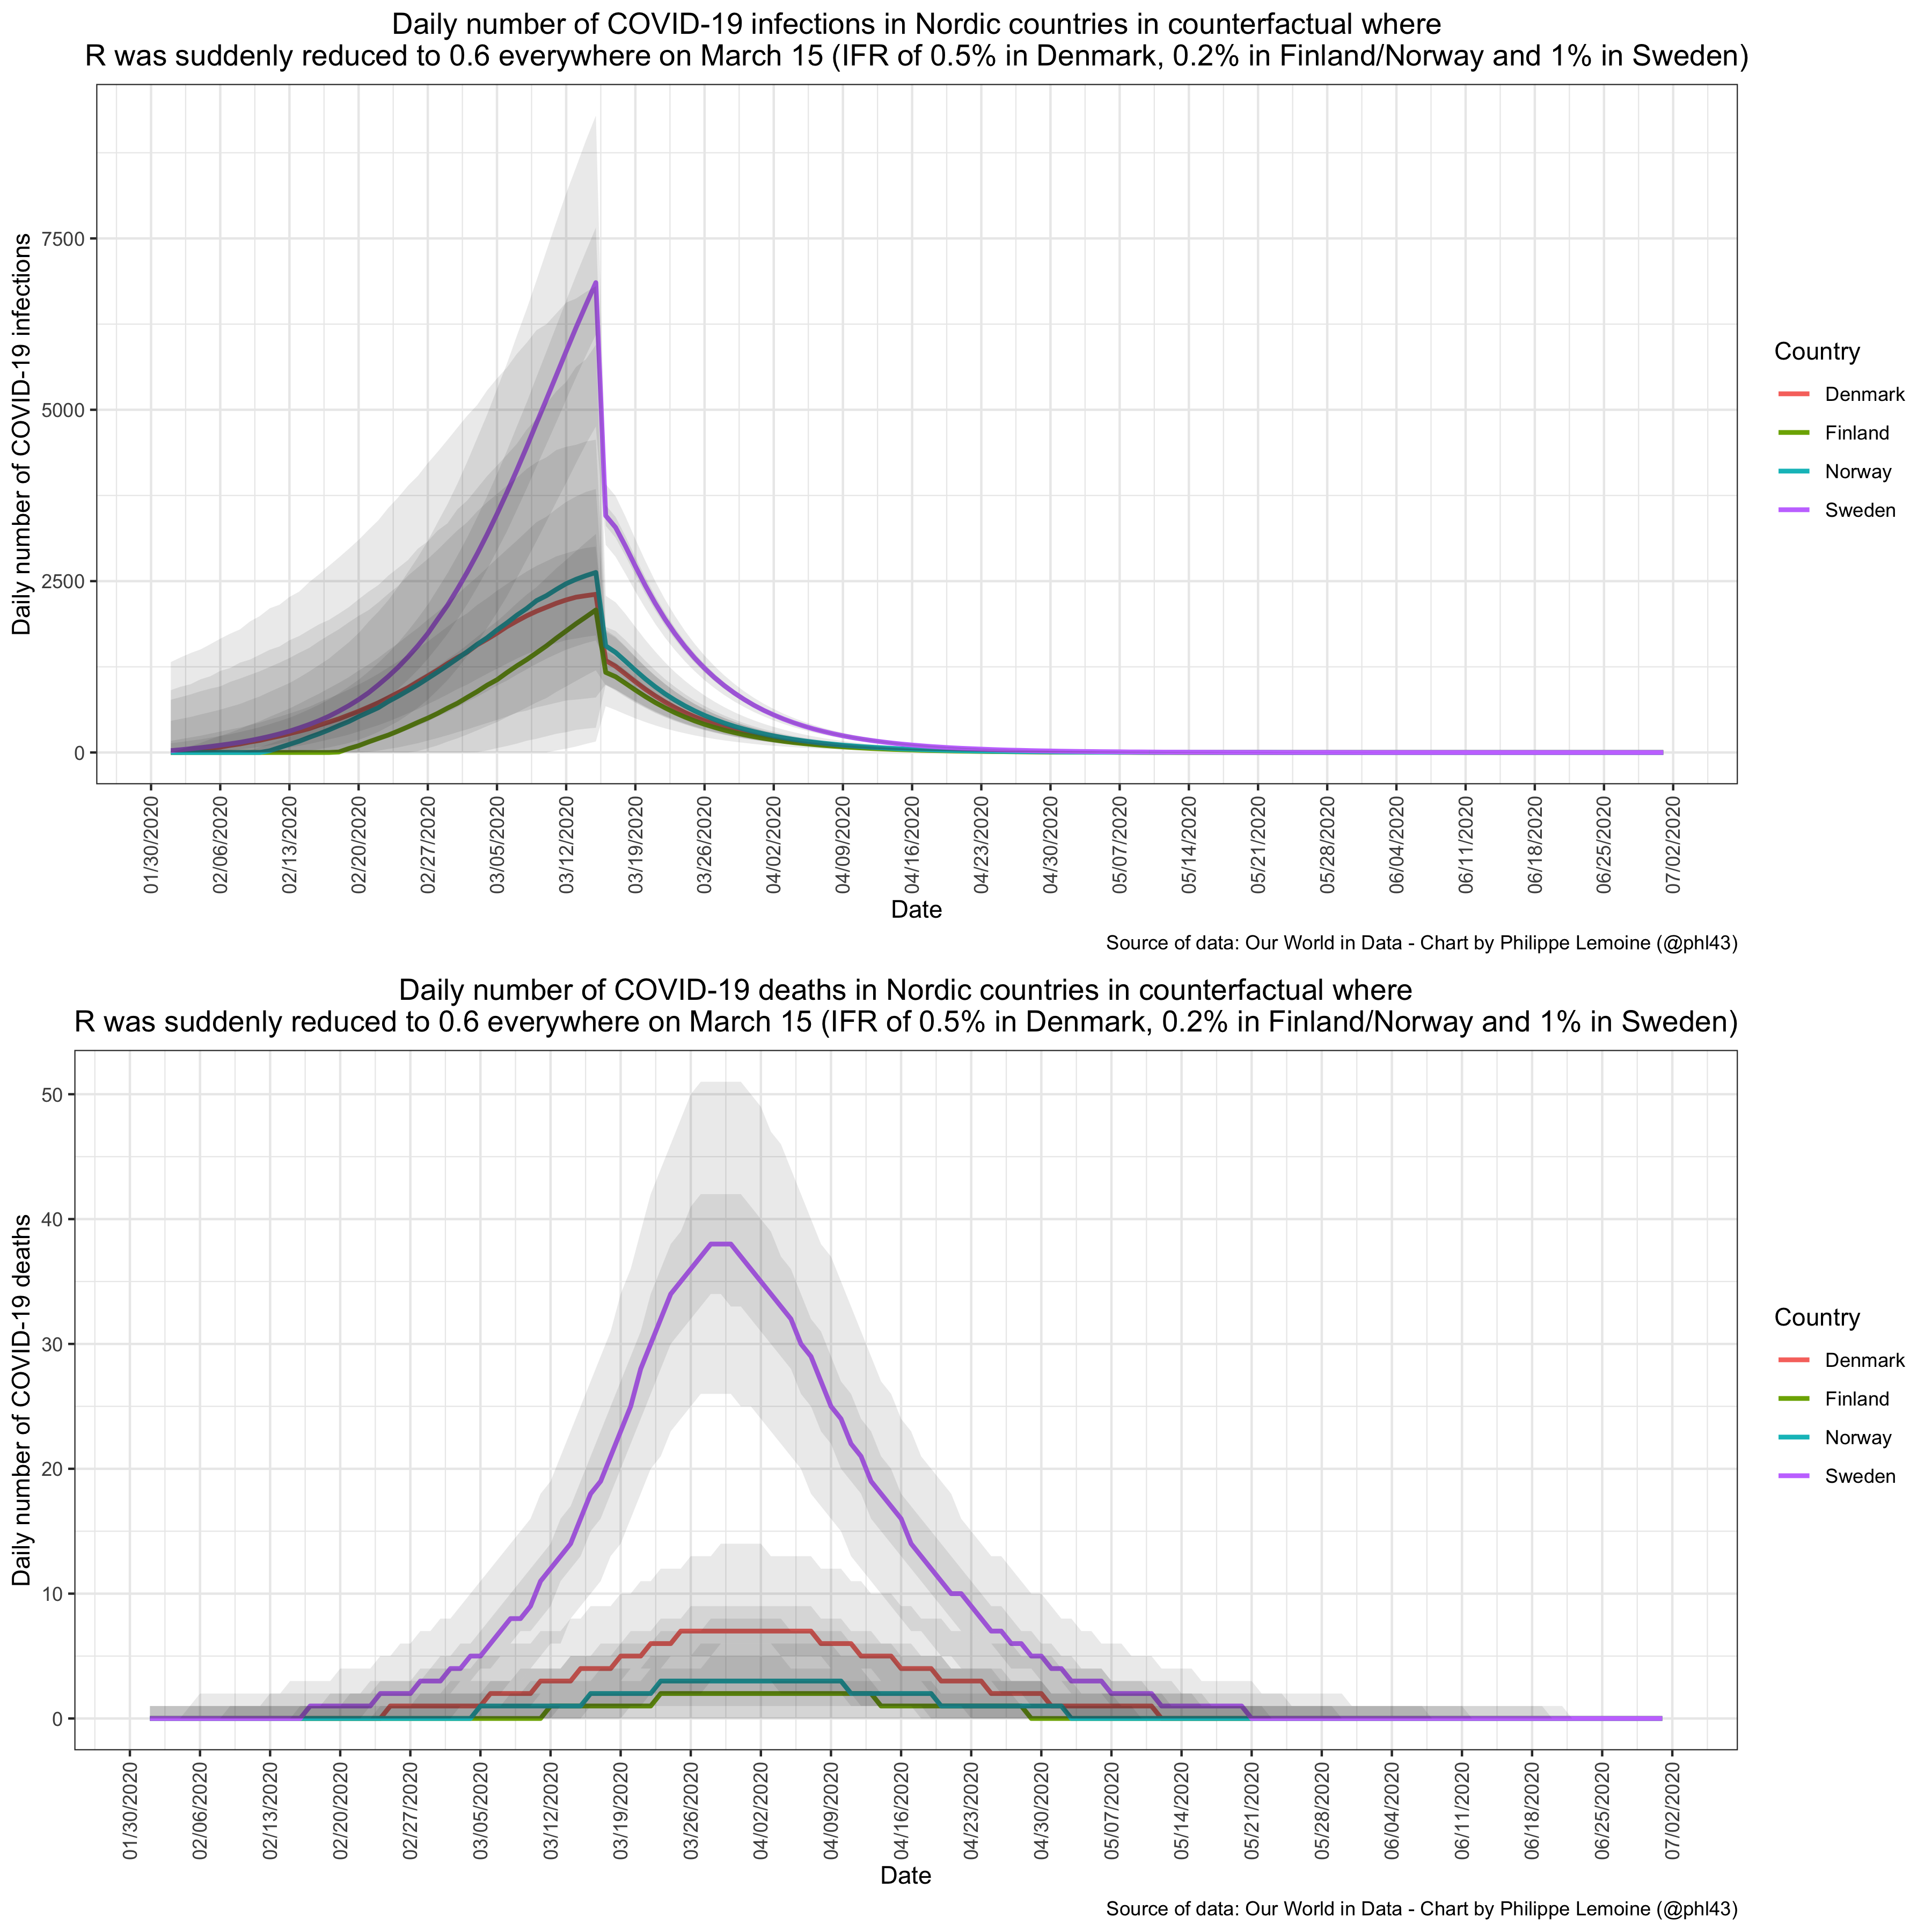 To be clear, I don’t believe for a second that such disparities in the IFR exist between Nordic countries, which have very similar demographics and similar health care systems, but even when you make such ridiculous assumptions the model still finds that incidence was already much higher in Sweden when its neighbors locked down. (The cumulative number of deaths are very similar to the previous sensitivity analysis, because while a lower IFR results in more infections in Finland and Norway, those in turn give rise to proportionally less deaths.) Frankly, I’m having a hard time to take people who deny that seriously, since again it’s already obvious from the data. The comparison of Sweden with Finland makes that particularly clear. In Sweden, there was already 48 deaths on March 31, 45 the day before and 53 the day after. Meanwhile in Finland, there were 4 on March 31, 2 the day before and 0 the day after. Finland didn’t lock down until March 16. Am I really supposed to believe that, with the right model, it wouldn’t be the case that incidence was far higher in Sweden than in Finland by the time the latter went on lockdown? Please.
EDIT: I added a chart in the last paragraph that shows a seven-day average of the daily number of COVID-19 deaths in Nordic countries to illustrate my point that what I’m saying is already obvious from the data and that one doesn’t need a complicated model to realize that it’s true.
ANOTHER EDIT: I realized that I had made a mistake in the code for the counterfactual, which resulted in the hypothetical lockdown starting on March 14 instead of March 15, so I fixed it and updated the charts in the post. It actually strengthens my case somewhat, but to be honest, it doesn’t really matter, since the date for the beginning of that hypothetical lockdown is largely arbitrary and the conclusion is also robust to the choice of that date. I have also rewritten the code to leverage parallel processing, so it should be significantly faster if your computer has several cores. The updated code is now on GitHub.
You might perhaps be interested in this post by a Swedish physician who also discusses several possible reasons for the higher death toll in Sweden. https://sebastianrushworth.com/2020/12/06/why-did-sweden-have-more-covid-deaths-than-its-neighbors/
He makes several points with regards to an earlier start of the epidemic in Sweden compared to its nordic neighbors:
– larger immigrant population and thus more international travel
– unfortunate timing of the Swedish skiing holidays, where many Swedes go skiing in the Alps, with the start of the epidemic there.
With regard to the latter point he also observes a clear difference between Stockholm and Gothenburg, the two largest Swedish cities, between which the timing of the holidays differed.
Of course this also does not prove anything, but it offers plausible factors of the kind that you conjecture, which might explain why there were many more cases in Sweden much earlier.
Thanks, another good piece on virus issues. I do have one question about the argument.
Measurements of IFR seem to actually be really different from place to place (like compare NYC to most other areas of the US, or Lombardy to Germany) and it’s very hard to believe that this is entirely due to inaccurate measurements. It looks like the Scandinavian countries are similar in age, but there may be other effects at play. For example, I think it’s plausible that greater hospital crowding could increase IFR even well short of the hospitals being full (less overworked staff are better able to treat people), and there is some research to this effect, although I don’t know how good it is.
How would it change things if Sweden’s IFR were twice Denmark’s, or half Denmark’s? Those both seem in the range of real possibilities.
Thanks, ultimately I doubt that such disparities in IFR exist between Nordic countries, but I admit that it can’t be ruled out. However, if you read the addendum I added to my post, you will see that my results are quite robust to pretty extreme assumptions about that and more.
I’m a bit confused as to why there is *any* uncertainty before March 15 in the covid-19 deaths in the counterfactual (the 3rd plot). After all, don’t we know the number of deaths before March 15 exactly?
Sorry, I actually simulated deaths by using the infection-to-deaths distribution for the whole period, but I get why it’s confusing and should have explained that and perhaps used the actual deaths until March 15. It was just simpler to simulate deaths for the whole period to be honest and it doesn’t make any difference to my conclusion, but I understand the confusion and my laziness isn’t really a good reason!
This is very convincing, because it also explains differences between other European countries, such as France/Germany during the first wave. So much meaningless BS has been made of variations in a random seed.
Since you think the implementation of interventions is not particularly explanatory, what is your explanation for why Sweden has had much worse outcomes than its Nordic neighbors?
Proximity to hotspot liken Lombardy wouldn’t be an answer. I don’t think that international travel early in in the pandemic would be either?
One reason could certainly be their treatment of seniors living in congregate housing. But I’m not sure their % of COVID deaths stratified by age is terribly different from the other Nordics as compare to their death rates – so poorer outcomes in senior housing (largely due to their euthanasia-like policies to target eliminating nosocomial spread) might not be much of an answer.
Seems to me that deaths as an outcome here just adds another potentially confounding variable as it folds in many aspects of treatment of the infected.
What’s more concerning regarding Sweden’s policy choices, IMO, is the rate of infection (particularly given thaf rhe ratio of infection to deaths seems to be fairly constant here in the US for quite a while now, so I’d imagine it might likely be in other countries as well). Sweden seems to have fared poorly on that metric, even though it has apparently tested at a lower rate. That’s not a good combo. I think that Denmark may be trending towards equalizing in that ratio… but still.
Death per 100k was 819. 2018 had 820 per 100k. 2019 was the least deadly year ever, which might explain some of this. But the 85 years or older has no big increase in the death rate, I guess we will find out when we got all the numbers.
Referrencing excess deaths across years and comparing across countries increases uncertainties and confounding variables considerably. I highly doubt it sheds any light on analyses that try to assess the efficacy of interventions.
Or overall mortality rates.
I don’t really have any explanation. As I note in the post, I think there is a lot of unexplained between-country (and even within-country) heterogeneity, but people don’t like uncertainty so they need to have a story that explains the heterogeneity. I’m just speculating here but I also think that stories based on policy differences are pretty appealing to most people because they have villains and hero. I agree with you that differences in attack rate seem to be the main driver of differences in mortality. I suspect that Sweden has a higher basic reproduction rate for some reason, perhaps not so much relative to Denmark but probably relative to Finland and Norway, but I don’t know why. Similarly, I’ve been very puzzled by Japan for months, because there seems to have been remarkably very little spread over there. Of course, people tell stories about how it’s thanks to Japan’s awesome local contact-tracing, and who knows they may even be right, but I don’t really buy it and what’s certain is that it hasn’t been demonstrated. Again I just think that people should be more willing to acknowledge that there is much we don’t understand about the factors that drive the epidemic, but I’ve been saying that for months and I don’t think many people are very interested in listening.
I agree that people are inclined to fit explanations to explain highly uncertain data – usually in alignment with their ideological predisposition and that’s usually not coincidental.
COVID is very much like many other polarizing issues, to a large degree becoming proxy ideological battles.
I think this is a situation of evaluating high damage risk, perhaps low probability high damage risk, in the face of uncertainty. It’s complicated by the context of fairly long time horizons.
The data that we have, especially early on, are limited by being cross-sectional. Trying to conclude causality from cross-sectional data is a setup for confirmation bias. As it switches into longitudinal data, hopefully it will get better but then we throw in the problem where people seem bound and determined to extrapolate from unrepresentative sampling, and there’s still the clear signal of political polarization.
Counterfactual thinking, as a form of conditional probability, doesn’t come naturally to people. I’ve been trying to get people to address the necessarily counterfactual nature of determining “lockdown deaths” and have yet to get anyone to actually address that issue. Counterfactual arguments require a level of evidence that we simply don’t have. In the same sense, sure, people are making assumptions about counterfactuals if they assume net positive value from interventions.
But again, for me, this is about risk in face of uncertainty. Personally, I think that.the risks of unchecked spread justify interventions when we lack sufficient causal data to “prove” that they return a net positive. Of course, interventions are not without risk for a net negative return, but even more convincing for me is that there are people sacrificing on a daily basis to enable someone like me to minimize my risk. That shifts my assessment. Every unit of risk added to their plate necessarily gets more value for me than adding a unit of risk to other people. Along a similar scale but to a lesser degree, I apply the same kind of heuristic to adding risk to people who are disproportionately at risk anyway due to structural inequalities.
Just to be clear. Anyone I’ve seen making the argument that that “lockdowns” “cause” deaths (IOW “lockdown deaths”) had been making poorly supported counterfactual assumptions about what the situation would have been had things been different. To assert “lockdown deaths” you’re assuming a causality when all you’ve really got is correlational data. Try applying something like Hill’s Criteria and the whole argument falls apart.
So since you have something of a public profile in the blogosoheric engagement about COVID policies, it might be interesting if you applied a similar brand of logic to deconstruct the assertion of counterfactual cauality w/r/t “lockdown deaths.” It might help to open up the discussion within the realm of your window. Probably not but you never know. I’d suggest maybe Andrew Gelman’s blog as a possible venue.
https://statmodeling.stat.columbia.edu/2020/12/18/inferring-the-effectiveness-of-government-interventions-against-covid-19/#comment-1621700
Lots o’ people that are pretty good there at analyzing counterfactuals and cauality and probabilistic reasoning. Maybe ask him if you could do a guest post. Just showing up in the comments might well disintegrate into typical blog comment threads bickering.
Or maybe take on Michael Levitt’s simplistic reasoning about “lockdown deaths” or the similarly simplistic reasoning of someone like Ivor Cummins or Ioannidis or Bhattacharya (I was shocked to see what Ioannidis was pushing – given that he’s pretty much been a leading figure in fighting against thar kind of stuff prior to COVID).
More at Gelman’s blog – including referencing Flaxman et al. response:
https://statmodeling.stat.columbia.edu/2020/12/25/flaxman-et-al-respond-to-criticisms-of-their-estimates-of-effects-of-anti-coronavirus-policies/
Hi Phillipe,
I understand that Covid is currently the topic du jour, but do you plan on commenting on the race/US law enforcement debate again any time soon? As an aspiring independent journalist and researcher I have found your insights in this area extremely helpful to say the least. Specifically, I would be curious to know if you’re familiar with Jeffrey A. Fagan and what you make of his contributions (for example, a study published this year titled “Race and reasonableness”). I’d also be curious to hear your take on Cody Ross’s 2020 study (Racial Disparities in Police Use of Deadly Force Against Unarmed Individuals Persist After Appropriately Benchmarking Shooting Data on Violent Crime Rates) on racial bias in police shootings which was in response to a 2019 study by Joseph Cesario (Is there evidence of racial disparity in police use of deadly force? Analyses of officer-involved fatal shootings in 2015–2016).
By the way, I discovered you and your blog through your appearance on Bloggingheads.tv. It would be great to see you chat with Glenn Loury again sometime, especially now that there are many more eyes on his show than when you appeared back in 2017.
Anyway, I hope you had a lovely Christmas, cheers.
You’ve spent a lot of time to prove something that was already widely understood/believed in Finland in the spring. Our lockdown was justified exactly by the fact that we could see what was happening in Sweden and assumed that they were a bit (e.g. few weeks) ahead of us (since they usually are in everything :D)
Not to comment on your conclusions (which I don’t entirely agree with), but I just find it interesting that the discussion about nordic cases/policies is on this level elsewhere.