[Note: This is a translation of the post I published in French yesterday. I wrote the translation very quickly, so there may be mistakes here and there, but on the whole it should be okay, although I am by no mean a professional translator.]
The post I published last week was more successful than I expected, since it has now been viewed more than 50,000 times. Unfortunately, given the number of people who continued to go out as if nothing had happened all weekend and even these past few days for many of them, it’s obvious that a lot of people still do not appreciate the gravity of the situation. I still think many people are now aware of it, but in large part because of the government’s disastrous communication and the no less disastrous decision not to postpone the first round of the local elections, it took longer than it should have and I fear that we’ll soon pay the price. Until now, despite the criticisms I have received after the publication of my previous post, things are going exactly as I predicted, but it does not mean it will continue and in fact we must hope it won’t.
Meanwhile, at the beginning of the week, a team of researchers from Imperial College in London published a report on the simulations they carried out to predict the evolution of health care demand, the results of which are absolutely terrifying and were presented to the government on the same day Macron nevertheless decided not to postpone the local elections. These simulations have been much commented in the press and on social networks, but in my opinion not in a critical enough way, probably because journalists do not have the necessary skills to understand how this kind of simulation works and that, even if this was not the case, they would not have time to study the model to understand the assumptions on which it’s based anyway. I will therefore devote a large part of this post to presenting the results of these simulations, before describing the type of model used to carry them out and discussing their reliability.
As I explain in this post, although I was very worried about the coronavirus epidemic at a time when most people didn’t take the threat seriously at all, I now feel a bit as if I were in the opposite situation. I continue to be very worried about the situation, but at the same time, I think a lot of people have gone from one extreme to the other and now consider that an apocalyptic scenario, of the type which is predicted by the simulations of Imperial College’s model, can no longer be doubted. However, as I explain below, I think that on the contrary the situation is characterized by a great deal of uncertainty and that it would be a mistake to fall into a bias opposite to that most people exhibited until the last few days . This post is very long and, at times, a bit technical, even though I tried to be as didactic as possible. If you are not sure that you want to read everything, I invite you to read the conclusion first, which can be used as a summary and is only 2,000 words long. But I recommend that you read everything and I hope the conclusion will make you want to.
According to the simulations, if we want to avoid a disaster, we must not just flatten the curve, we have to nuke it
In my previous post, I presented this chart [note: this was originally a chart in French, so I substituted a similar chart in English], which everyone has seen by now: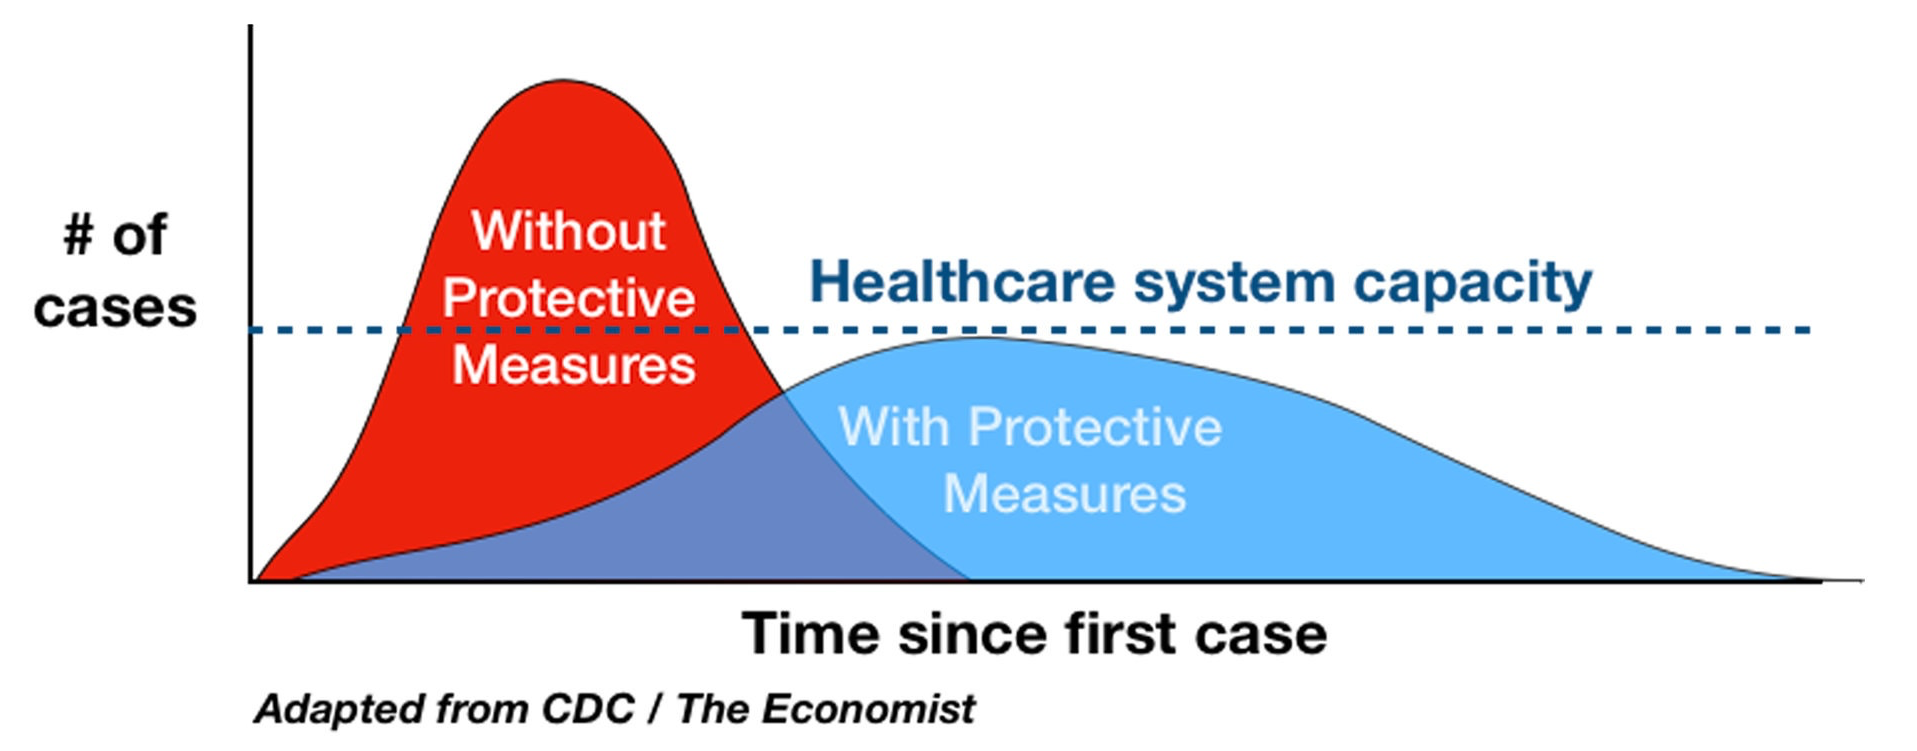 Unfortunately, the main lesson from the simulations I’m going to talk about is that this chart and all others like it, that have been made to explain the importance of flattening the curve, are extremely misleading.
In theory, the idea illustrated in this chart is excellent, but in practice the simulations of the team at Imperial College suggest that this strategy is completely unrealistic. The basic problem is that in all those charts that have been made to illustrate the concept of flattening of curve, the line that represents the capacity of the hospital system and the curves that show the number of cases with and without policies in place to mitigate the epidemic were chosen in a perfectly arbitrary fashion or rather so that the idea that the chart is meant to convey be clear. But what would happen if, in fact, the number of cases with or without policies in place to curb the spread of the virus was much higher compared to the capacity of the hospital system? Ideally, we would like to know what would happen depending on the policies that we put in place, which is precisely the purpose that Imperial College’s simulations are supposed to serve.
They picked 5 non-mutually exclusive policies and made various hypotheses about their immediate effects and the degree to which the population complies with them: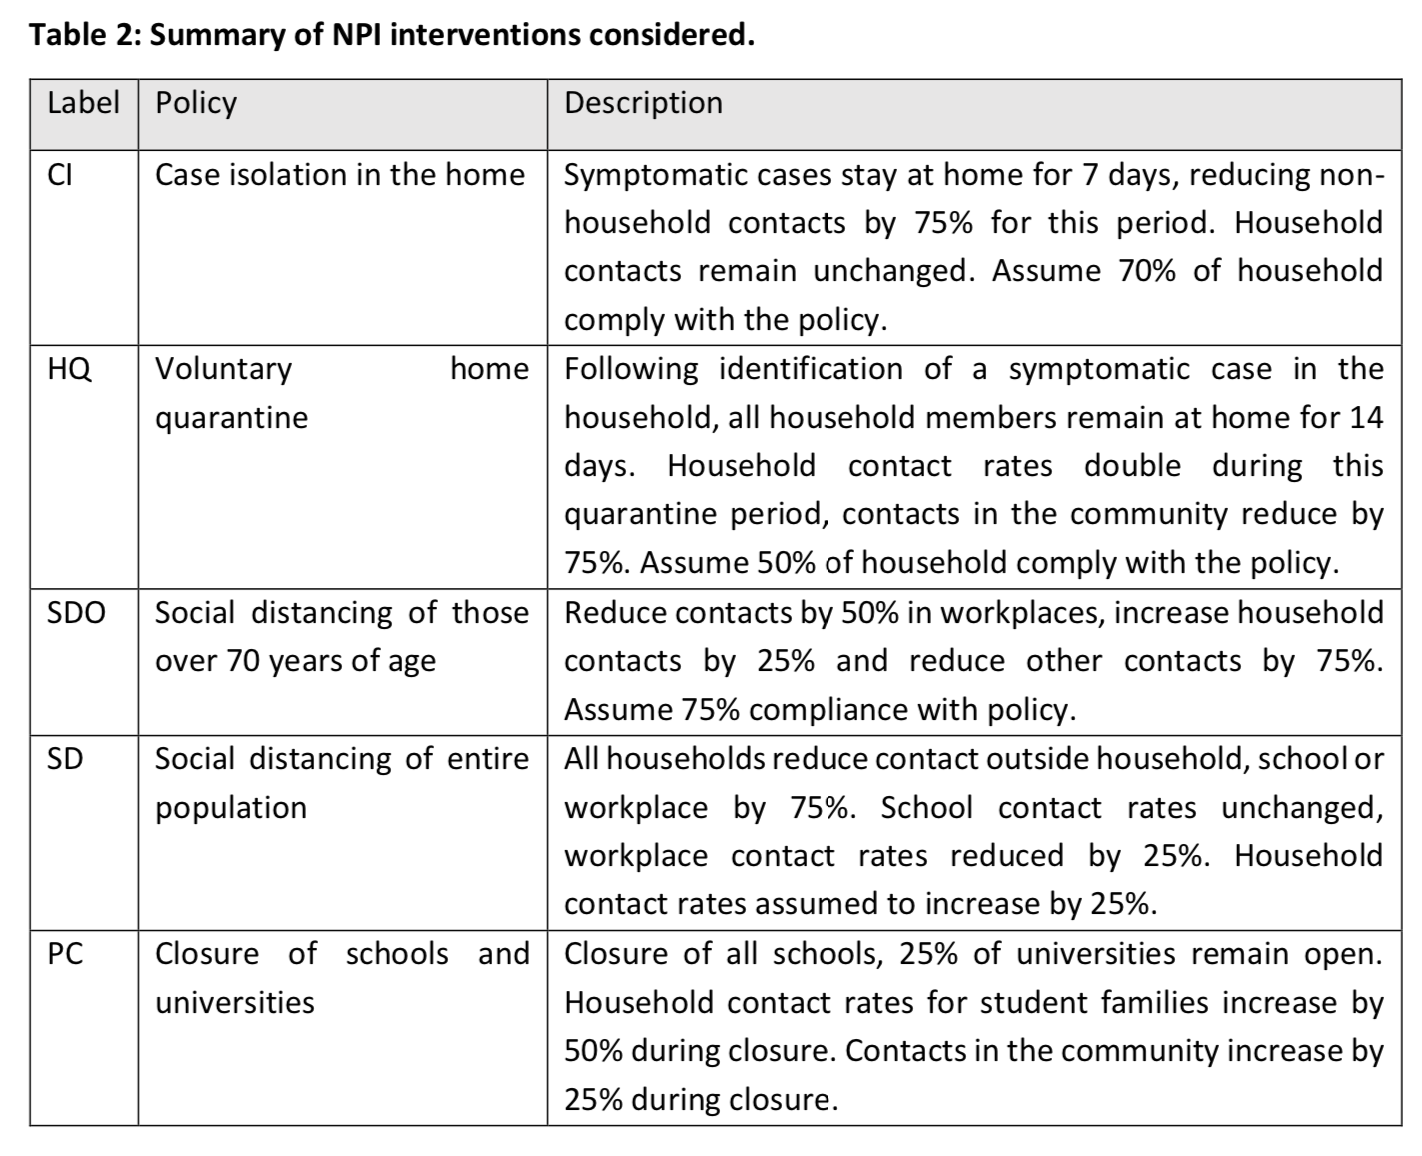 The assumptions they make are, by their own admission, relatively pessimistic, but in my opinion not crazy either. They run their simulation model with different combinations of these policies in place to estimate the effect they would have on the need for intensive care beds and the number of deaths.
The purpose of this exercise was to determine what the curve flattening graph would look like if the scale were realistic and, according to the simulations, this is what it looks like in the case of Great Britain: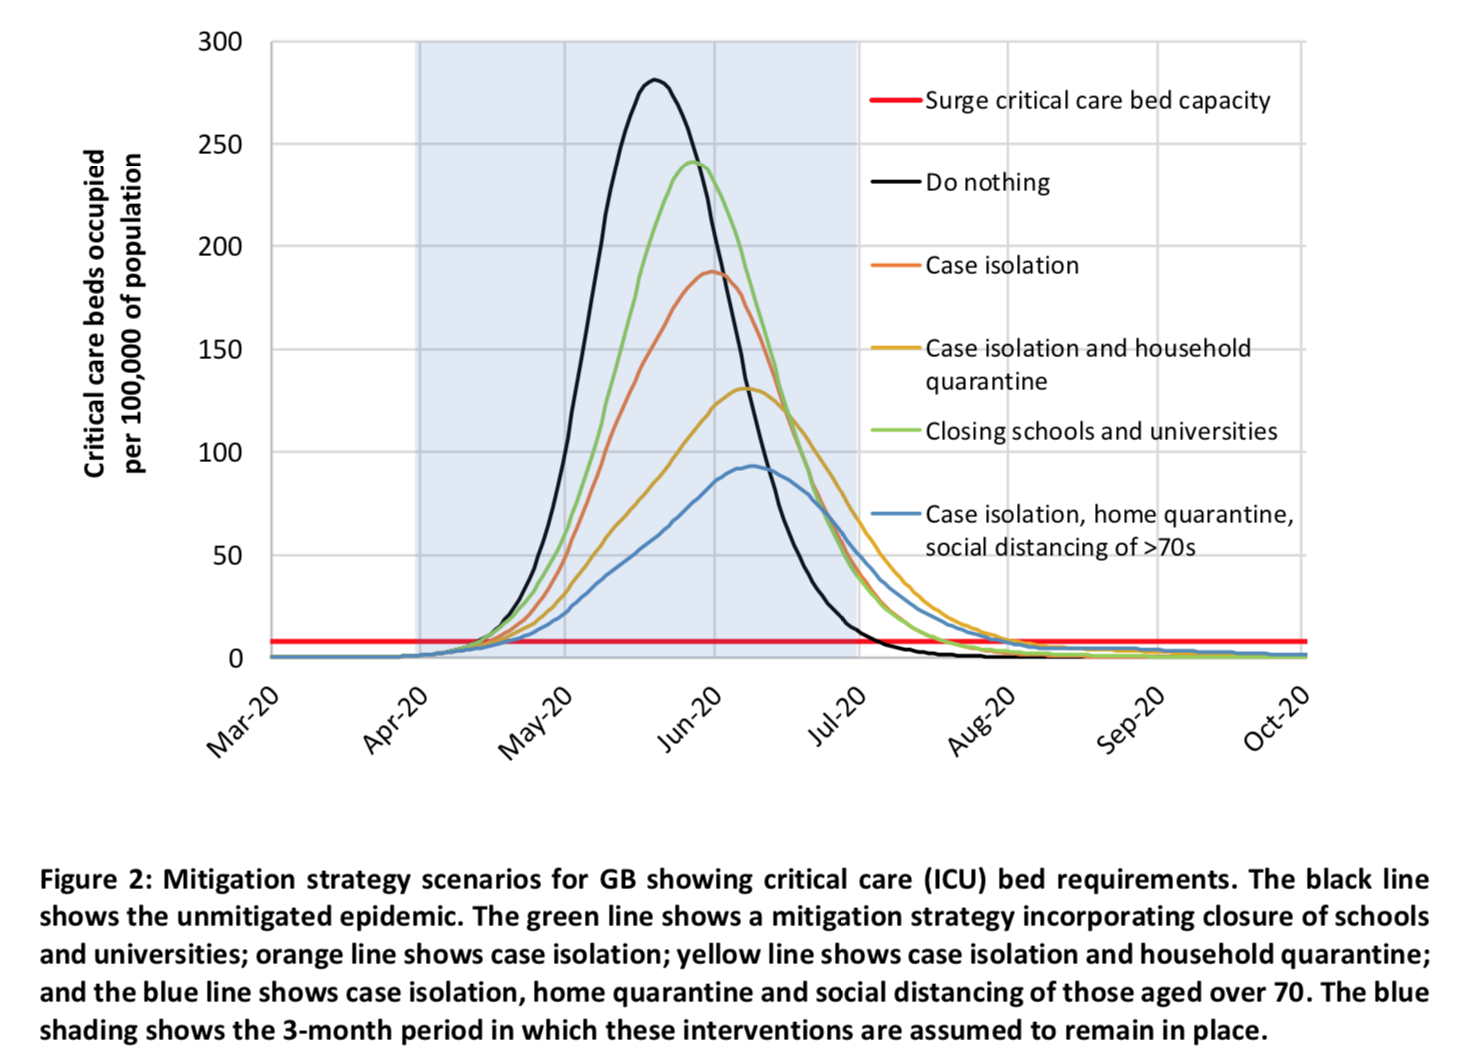 The red line at the bottom shows the maximum capacity of the British hospital system in terms of ICU beds, the black curve shows the evolution of the number of people who will need a bed in intensive care if nothing is done to mitigate the spread of the virus and the other curves represent this same thing if various combinations of policies are put in place to curb the epidemic starting from the end of March and remain in place for 3 months after that.
As you can see, if nothing were done to mitigate the epidemic, the need for ICU beds would very quickly exceed the capacity of the hospital system and, at the peak of the epidemic, Great Britain would need 30 times more ICU beds than its maximum capacity. Even if the strategy deemed optimal by the model were adopted, at the peak of the epidemic (which would occur later and be much lower than without any policies to mitigate the epidemic), the need for ICU beds would be more than 8 times greater than the maximum capacity of the hospital system. In other words, even if pretty restrictive policies were adopted with the modest goal of slowing down the epidemic (isolation of cases diagnosed at home, quarantine of all members of a household where a case was identified and social distancing for people aged 70 and over), the hospital system would be completely overwhelmed and a huge number of people who need them would not have ICU beds. In addition, the study’s authors explain that, even if we did that, depending on the proportion of people who will have acquired immunity to the virus and on the effectiveness of that immunity (which remains very uncertain at present), it is not out of the question that a similar epidemic would break out a few months later.
In addition to the effect on the need for ICU beds, the authors also calculated the number of deaths that would result from the epidemic according to the scenarios they tested. This chart shows the evolution of the number of deaths in Great Britain and the United States if nothing is done to mitigate or suppress the epidemic: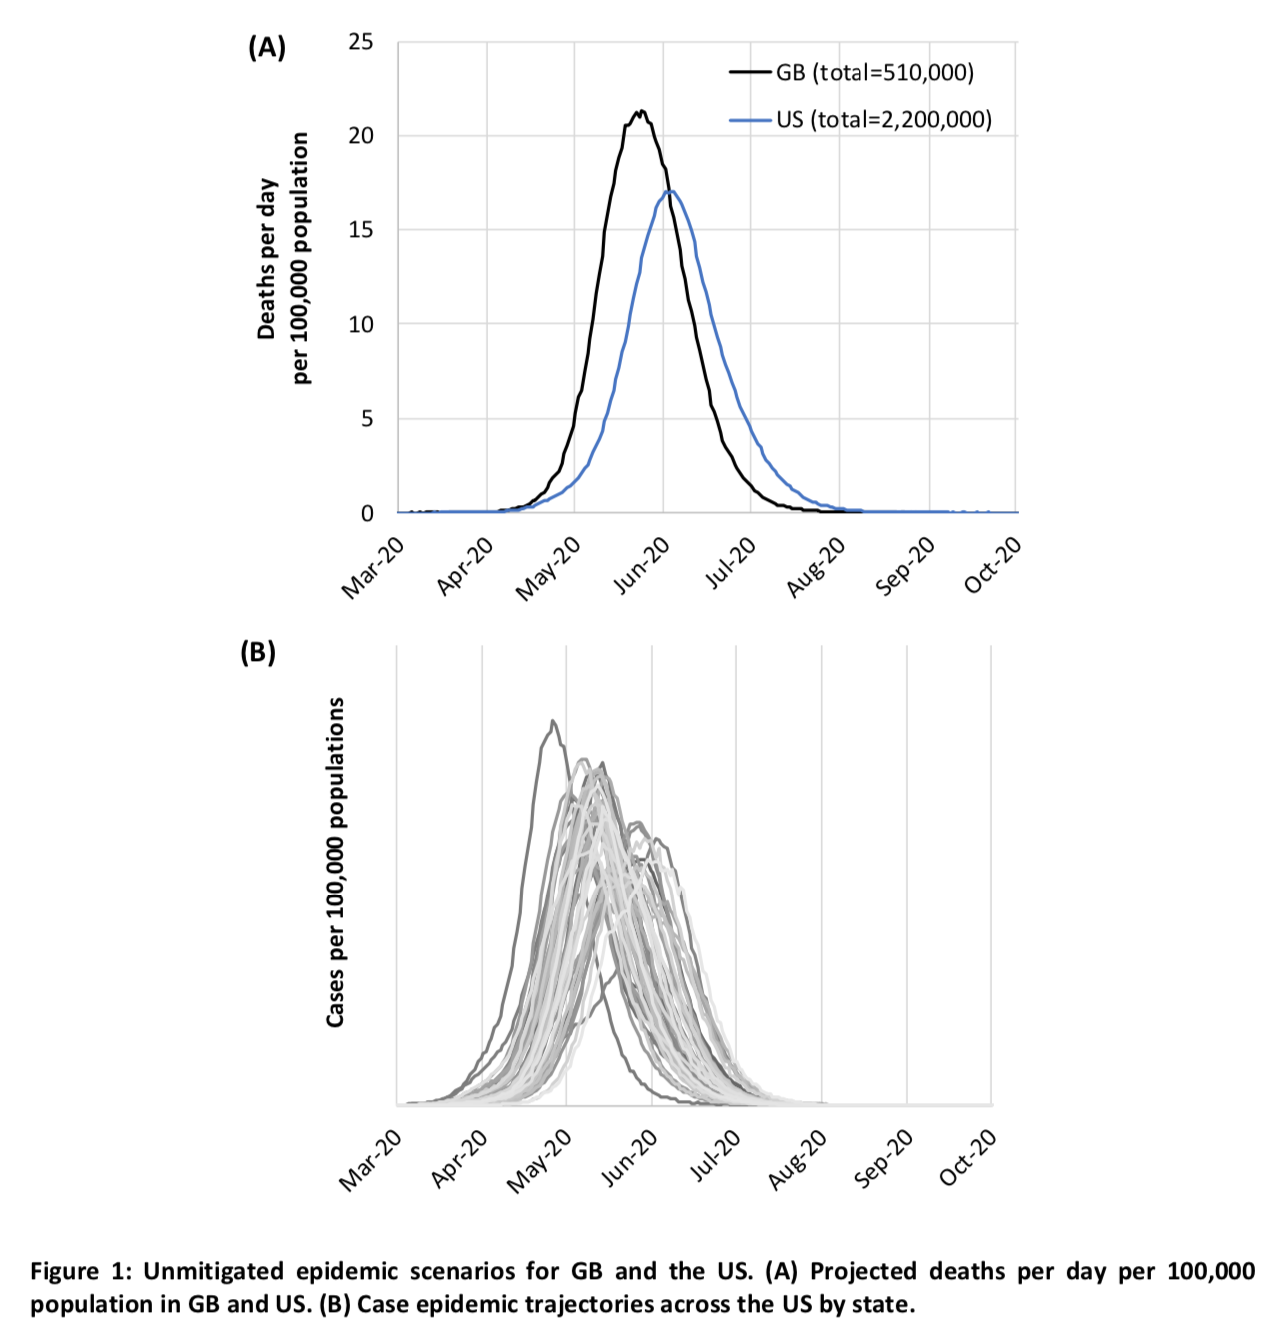 The total would therefore reach the chilling figure of 510,000 deaths in Great Britain without Northern Ireland and 2.2 million in the United States without Hawaii and Alaska, that is to say respectively almost 0.8% of the population and less than 0.7% of the population.
The United States would therefore fare slightly better, probably because it has more ICU beds per capita and a lower population density, which also explains why the peak of the number of deaths occurs a bit after Great Britain. However, this is the number of deaths predicted by the model when you assume that if hospitals are overwhelmed it won’t have any effect on the infection fatality rate, despite the fact that, according to the model, the needs for ICU beds will exceed capacity by a factor of 30 at the peak of the epidemic, which obviously is completely false. Indeed, as I explained in my previous post, the main danger of this epidemic, beyond the fatality rate which seems relatively high compared to the flu and other viruses that we are used to, is that apparently a large proportion of infected people require admission in ICU where they apparently stay pretty long.
The risk is therefore that many people who would survive if they had access to an ICU bed with a ventilator are going to die because there are not enough of them, in which case the actual fatality rate would be much higher than what the model assumes. Thus it’s clear that, if the model is even remotely accurate, the number of deaths if nothing is done will be much higher than the estimates found in the report. This is a crucial point which, to my knowledge, has not been noted in news stories such as this one in Le Monde on Imperial College’s simulations. France has more ICU beds than Great Britain and a significantly lower population density, but given the predictions of the model for the United States, which has way more ICU beds than we do and a much lower population density than France, the carnage would probably be of the same order as in Great Britain and the United States. From what I understand from this article in Le Monde, simulations have been made with the same model with parameters calibrated with French data and they predicted a death toll of between 300,000 and 500,000 deaths depending on whether policies were taken or not, which is consistent with the points I just made.
In the case of a strategy merely intended to mitigate the epidemic, the policies are triggered only when the number of cumulative ICU admissions exceeds a certain threshold, after which they remain in place continuously for 3 months. (I should point out that, on this point as on many others, the report is not very clear . However, in my opinion, this is the interpretation that makes the most sense given what the authors write. ) The following table summarizes the predictions of the simulations depending on the hypotheses made about the basic reproduction rate and the threshold used to trigger the policies: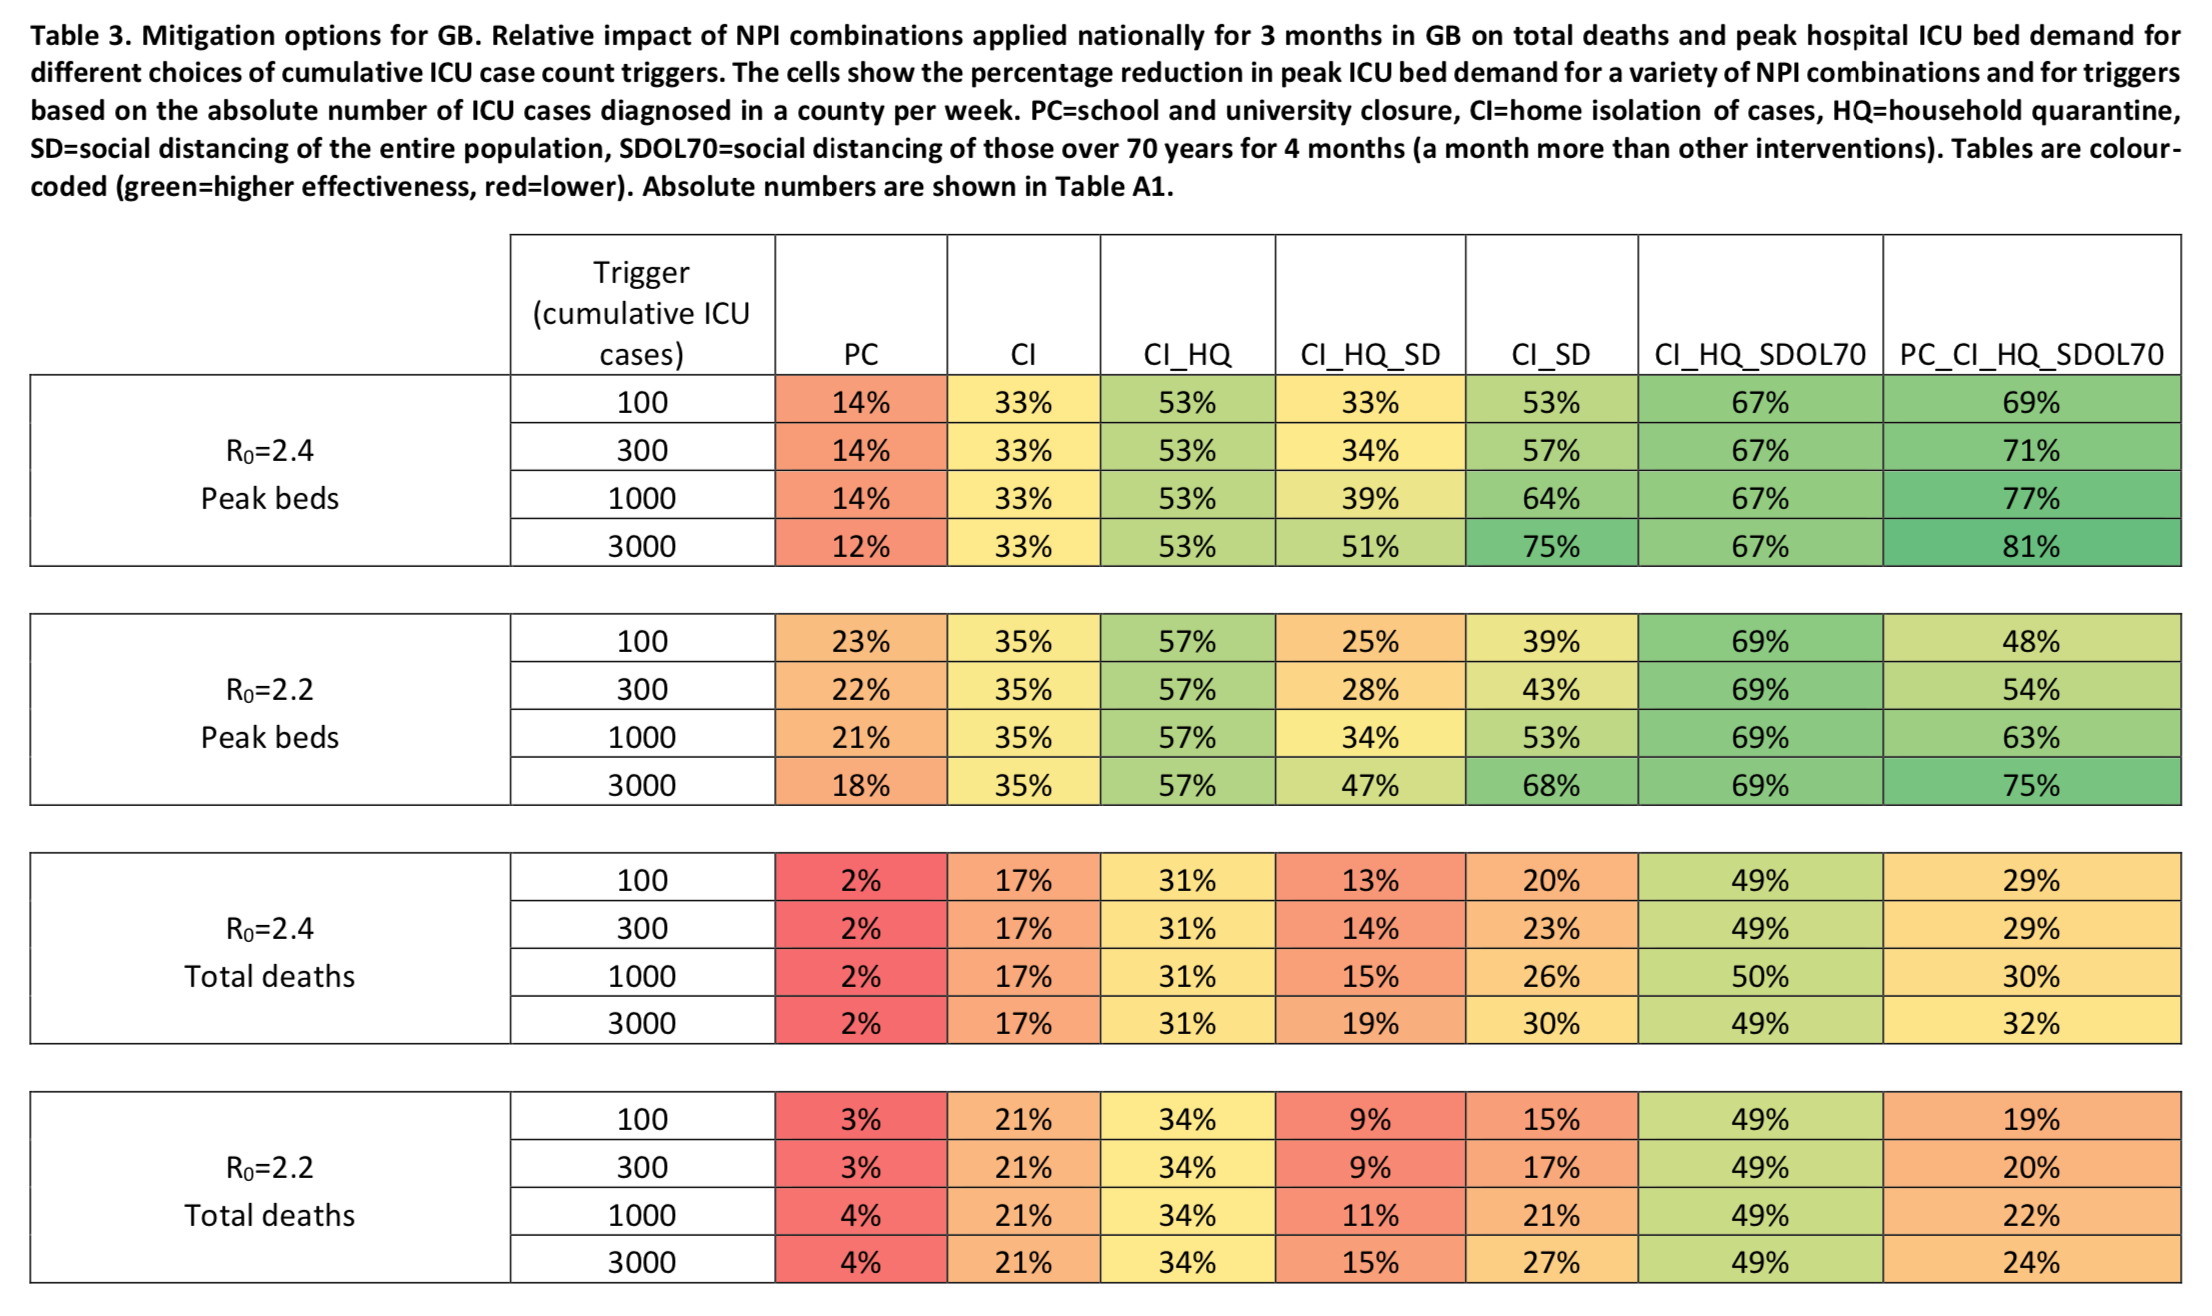 Each cell in the table says by how much the number of ICU beds or the number of deaths at the peak of the epidemic would be reduced depending on the assumption made about the basic reproduction rate, the combination of policies adopted to slow down the epidemic and the threshold used to trigger them.
Some of these results may seem counterintuitive. For example, at first glance, it’s weird that adopting generalized social distancing in addition to case isolation in the home and voluntary home quarantine has a smaller effect on the number of ICU beds needed and the number of deaths. But given the fact that generalized social distancing doesn’t just have the immediate effect of reducing contacts outside the household, but also that of increasing contacts within it, one can totally imagine that the latter effect more than compensates for the former, provided that a sufficient level of contact persists between households. This is really the kind of questions that I think intuition is powerless to answer, but where simulations could provide answers, a point to which I return later. But for now, it should just be noted that, if the predictions of the model are reliable, none of the combinations of policies examined during this exercise, the aim of which is merely to mitigate the epidemic without however seeking to prevent the virus from infecting a significant proportion of the population in the long term does not make it possible to reduce the number of deaths by more than 50%. In other words, even applying the optimal strategy among the different combinations that were tested, more than 250,000 people in Great Britain and more than a million in the United States would lose their lives. Again, this is when you assume that overwhelming hospitals won’t increase the infection fatality rate, which is obviously wrong. The study’s authors therefore conclude that such a strategy, aimed simply at slowing down the epidemic without suppressing it, is untenable because it would claim too many lives.
Thus they consider another type of strategy, which doesn’t just aim at slowing down the spread of the virus while accepting that it will eventually infect a large part of the population, but at suppressing it altogether to avoid the collapse of the health care system. The policies they test to achieve this objective are either 1) a combination of case isolation in the home, voluntary home quarantine and generalized social distancing or 2) a combination of closure of schools and universities, case isolation in the home and generalized social distancing. The immediate goal of these strategies is to push 
Their simulations show that a strategy of this type would manage to get the epidemic under control temporarily, but that as soon as the policies were lifted, the number of infections would start to increase again and that an epidemic of similar magnitude would occur in the Fall: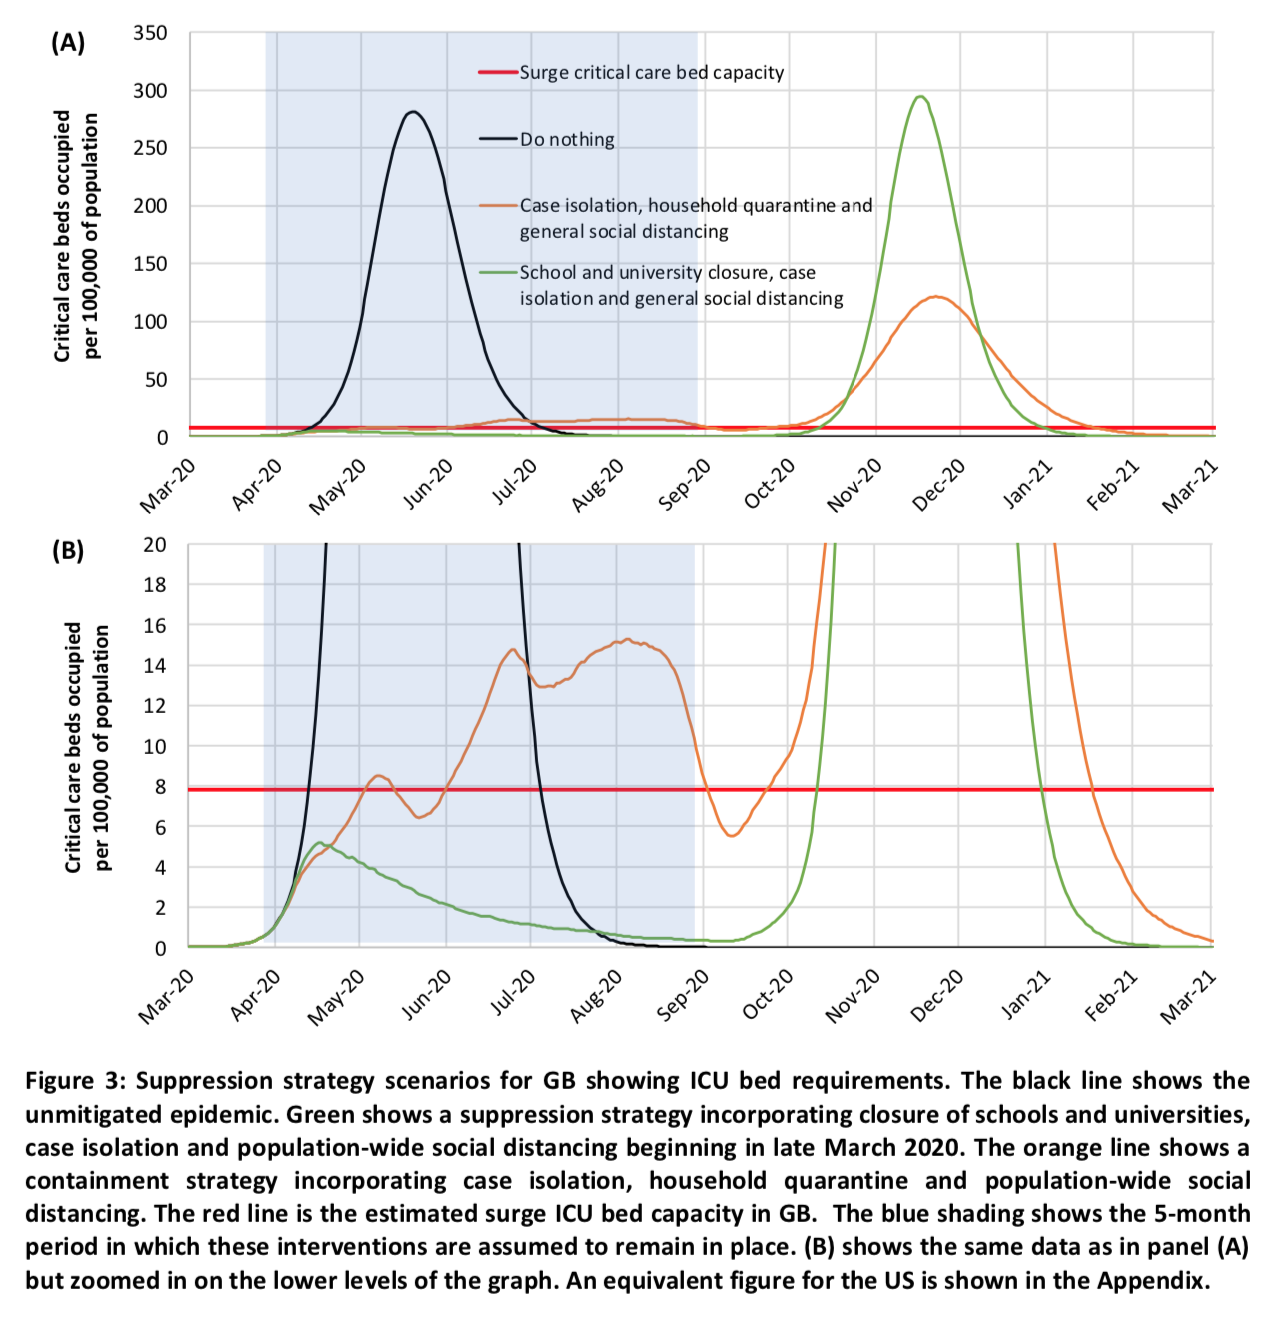 The magnitude of the peak after the policies are lifted depends on the exact strategy adopted and in particular on how efficient it was at reducing the number of people infected. The strategy combining case isolation in the home, voluntary home quarantine and generalized social distancing is thus preferable because, as we see on the bottom part of the chart which “zooms” on the lower levels of the graph, more people are infected with this strategy while the policies are in place.
Thus, with a strategy of this type, the situation we end up with is similar to what happens in the case of a mitigation strategy, that is to say a carnage, only it occurs later. The only way to avoid this outcome would be to keep the suppression policies in place until we have a vaccine or another effective pharmaceutical intervention, but in the case of a vaccine it will not happen until at least 12 month. As Michael Osterholm, an expert in infectious disease epidemiology recently explained , the problem is not so much to find a vaccine as to ensure that it does not have any harmful side-effect that would make it a health risk. Given the magnitude of the crisis, we may be able to speed up the process a bit compared to ordinary procedures, but we still have to be careful. Obviously, keeping such restrictive policies in place for so long would have a devastating effect on the economy, so the study’s authors imagined a mechanism to ensure that some of them are only in place intermittently. Generalized social distancing and, if it’s used (which as we have seen is only the case in one of the combinations of policies they tested), the closure of schools and universities are triggered only when the number of weekly ICU admissions exceeds a certain threshold and they are lifted as soon as it drops below a fraction of this threshold. The other policies, if they are used, remain in place all the time.
Here is what, according to the simulations, it would look like in the coming months: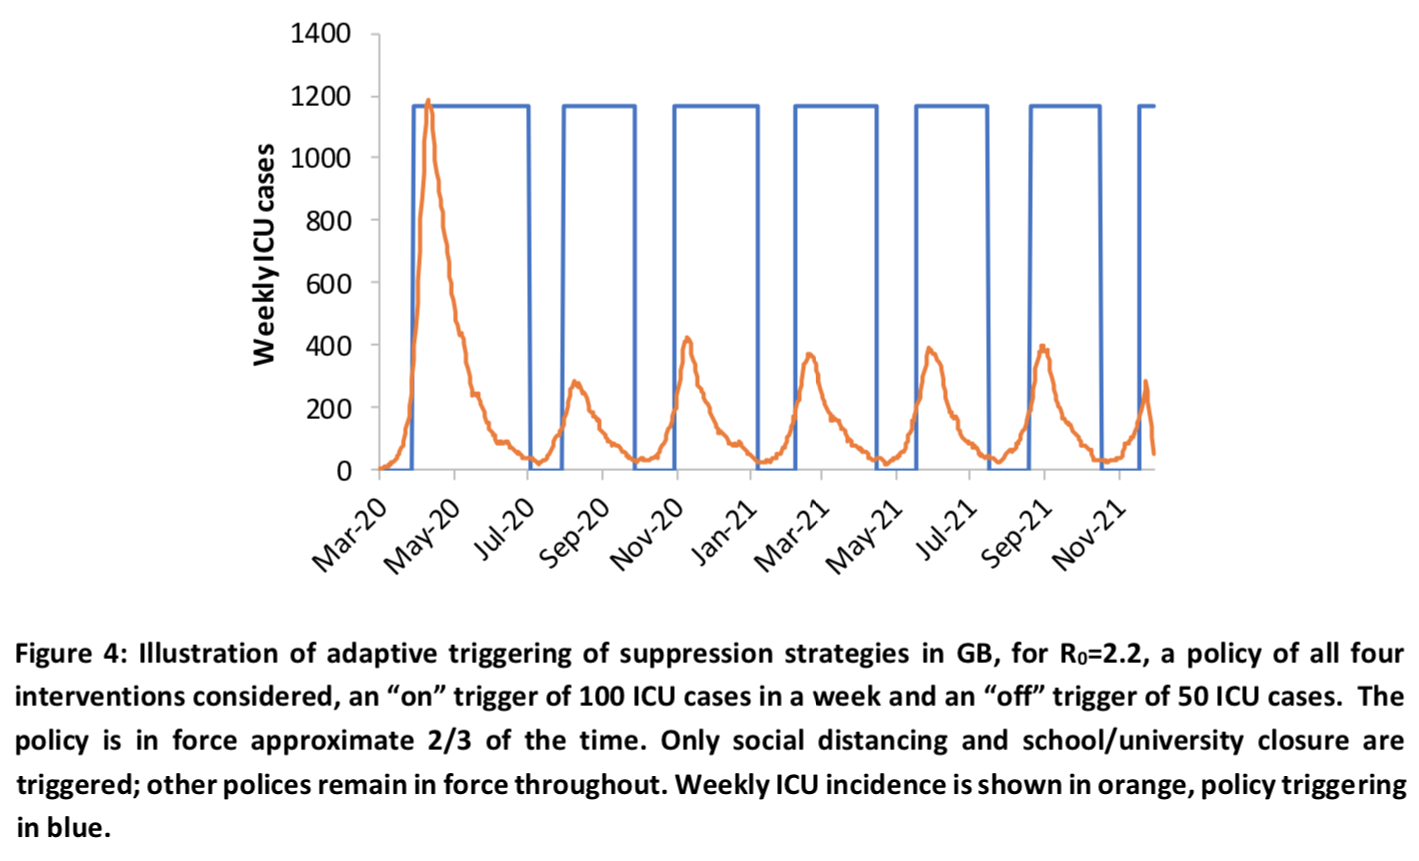 We see that even if this type of strategy would be quite effective, all the policies would still have to remain in place 2/3 of the time, so it would presumably have only a very limited effect on the economic contraction. In any case, if the model is correct or even just not completely off, unless we accept that a truly appalling number of people are going to die in the months to come until herd immunity kicks in and stops the spread of the epidemic after a sufficient number of people have been infected and have acquired immunity, we are going to be faced with the worst economic crisis in modern history. Even if we decided to adopt a strategy aimed only at slowing down the epidemic, by accepting the enormous human cost, that would probably still be the case, but the shock would nevertheless be much less brutal since it wouldn’t last nearly as long and that, from a strictly economic point of view, the death of a large number of elderly people could actually prove to be a positive shock in the long-run. To be clear, I’m not recommending this strategy, I’m just explaining what its likely consequences would be if the simulations are correct.
The chart I just presented shows the results of the simulations when the following 4 policies are used: case isolation in the home, generalized social distancing, voluntary home quarantine and closure of schools and universities. As I explained above, in the case of generalized social distancing and the closing of schools and universities, the policies are only in place intermittently. The following table shows the effect of different combinations of policies, corresponding to different possible suppression strategies, on the number of deaths and the need for ICU beds, as well as the proportion of time during which social distancing and the closure schools and universities (for the combinations that include this policy) would remain in place depending on the hypothesis made about the basic reproduction rate and the threshold used to trigger the policies, which are lifted as soon as the number of weekly ICU admissions goes below 25% of the activation threshold: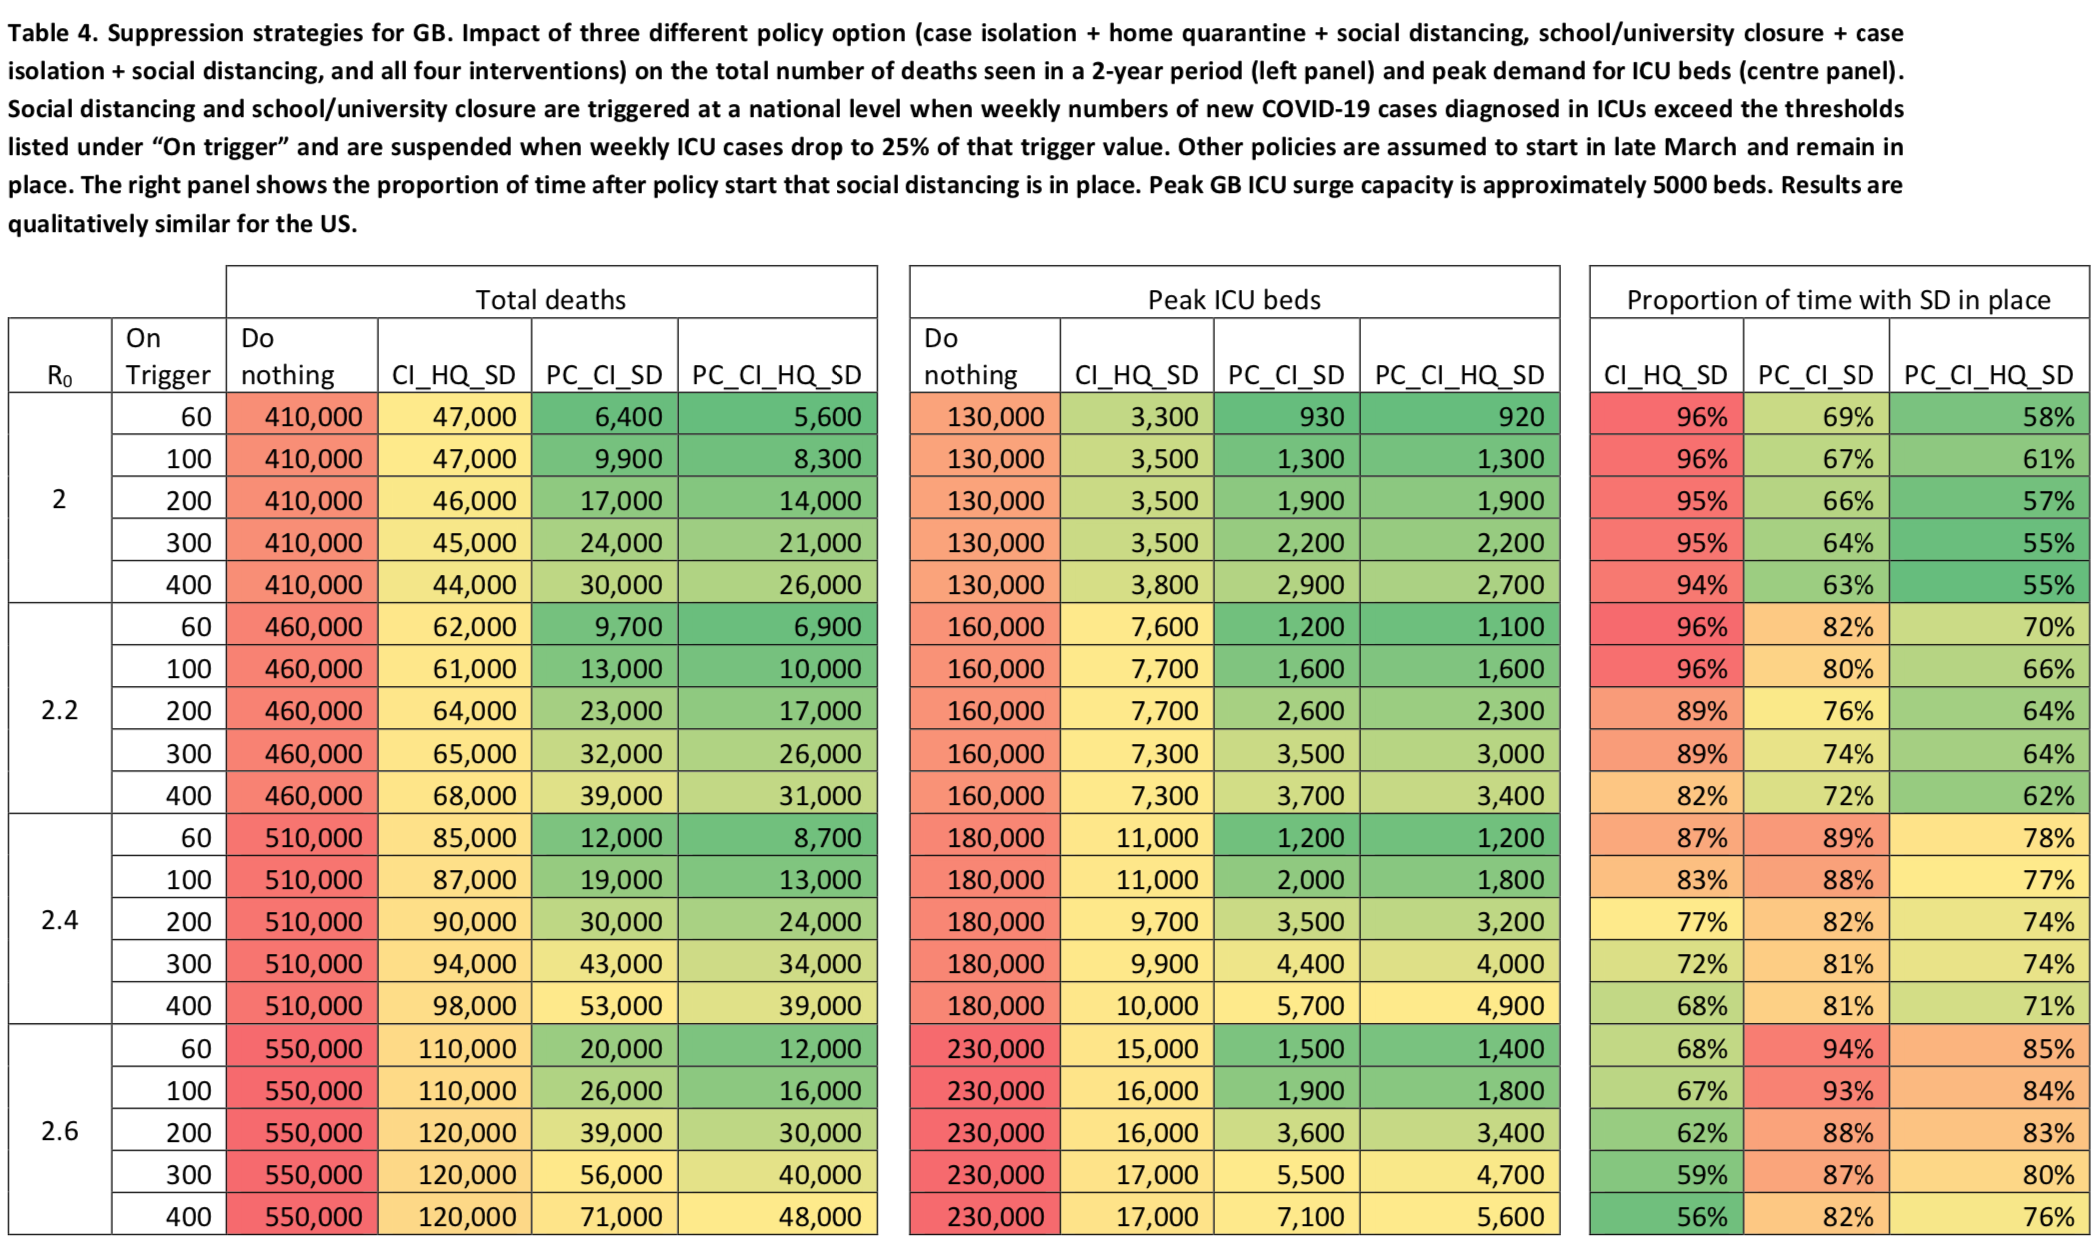 Again, the estimate of the number of deaths assumes that the infection fatality rate will not increase due to the lack of ICU beds, which is of course false, so the reduction in the number of victims allowed by this strategy in comparison to the number of deaths that would actually occur if nothing were done would probably be much larger than what this table suggests, since it would prevent the hospital system from being overwhelmed and the infection fatality rate to blow up.
The authors also ran simulations to see how the number of deaths would change depending on whether the policies are lifted when the number of weekly ICU admissions reaches 25%, 50% or 75% of the activation threshold: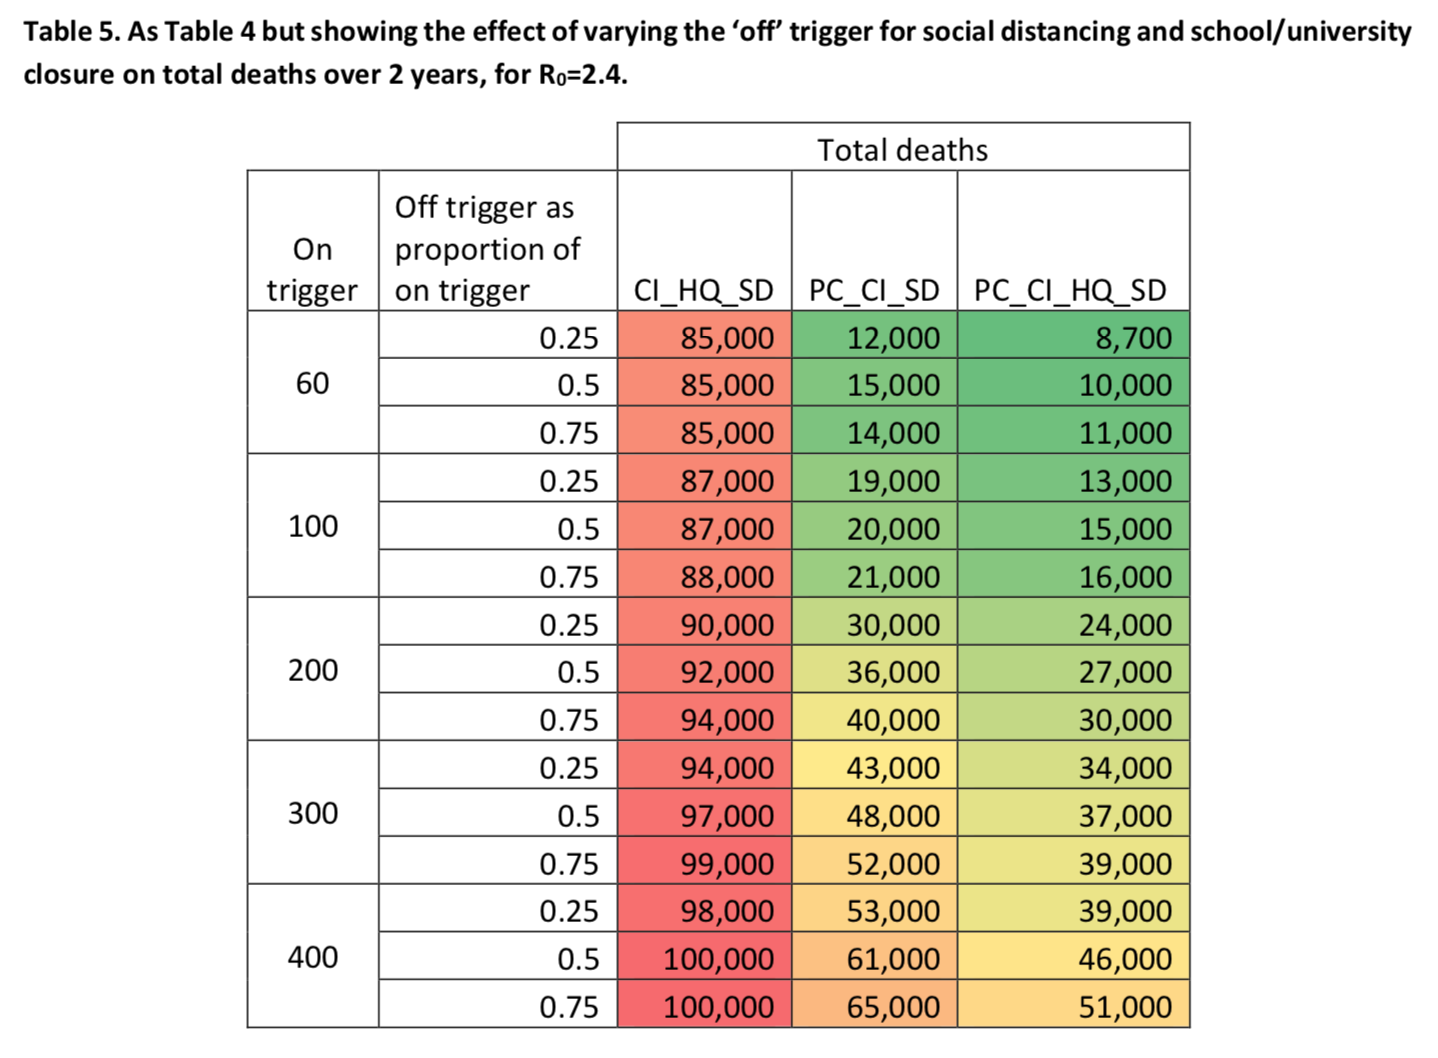 We see that, no matter what threshold is used to trigger the policies that were adopted, the longer we wait to lift generalized social distancing and the closure of schools and universities (if this policy is part of the combination that is used), the less people die, which makes sense.
If the predictions made by those simulations are correct or even if they’re not but they’re also not completely off the mark, then we are headed toward an unprecedented health disaster. This would mean that we should not only build ventilators, we should probably build ventilator factories . The British government, which is chiefly concerned by those simulations, has already asked several industrial companies, including Rolls-Royce, to repurpose their factories so they can start making ventilators as soon as possible. France is apparently better equipped, but if these simulations are correct and even if they largely overestimate the needs, it will be far from enough. However, I have not read anywhere that the French government has taken similar measures, it just seems to be counting on foreign production capacities. I don’t need to say that, if the predictions of this model are in the right ballpark, it will be carnage unless we remain confined for months and, in that case, our economy will be destroyed for a long time. I repeat once again that the number of deaths in this study are based on the assumption that the fatality rate will remain unchanged even when the needs for ICU beds far exceeds our capacities. I will come back to the policies which I think should be adopted later, but first I want to look under the hood of these simulations and explain how the model works. Indeed, the predictions of this model are apocalyptic, but can we really trust them? We cannot answer this question without first understanding how the model works.
A brief description of the model used to perform those simulations
The report that was released on Monday does not give a lot of details about the model, but it refers to another, older paper that is supposed to describe the type of model used. This paper doesn’t contain that much details, even in the supplementary notes, but those refer to yet another paper whose supplementary notes contain a more thorough description of the type of model used to run the simulations whose results I just presented. What follows is going to be a bit technical, because I think it’s important to go into the details to really understand how this type of model works and appreciate the uncertainty that characterizes the results, but I’m going to try to make sure that even if you don’t understand everything, you can still understand the gist of it. But don’t despair and hang on, because after this section I’ll come back to a less technical and easier to follow discussion.
The model randomly generates a population equal to the population of the country where the epidemic it simulates is unfolding, which is randomly distributed over the country’s territory in such a way as to reproduce the population density of that country according to census data. Thus, in the case of Great Britain without Northern Ireland, it generates a population of about 64.5 million people. Each individual is assigned to a household of varying size and, depending on his or her age, to a school/university or workplace. This allocation is also done in such a way as to respect the distribution of household sizes and age structures, as well as the distribution of workplace size and distribution across the territory. All these parameters are estimated from survey data that are regularly produced by statistical agencies in all developed countries. They are therefore approximations, especially since simplifying assumptions are made and since these are declarative surveys that may be unreliable on certain issues, but presumably they’re not too far off either.
The aim of the model is to simulate the way the epidemic spreads in the population. At each stage during the simulation, each individual is either infected or not infected, with the model updating this status as it unfolds depending on the contacts individuals have with each other. Similarly, each individual is either susceptible or non-susceptible, depending on whether or not he or she has acquired immunity after becoming infected. In the case of a seasonal influenza epidemic, the model assumes that a relatively large proportion of the population is not susceptible at the onset of the epidemic, most notably because many people are vaccinated. But this is not the case for the coronavirus, which is a novel pathogen for which there is no vaccine yet. So they are making the assumption that everyone is susceptible at the beginning of the epidemic and, although the report is not clear on this point, I think they also assume that everyone is equally susceptible. This assumption is probably wrong, especially if we believe the data from a small town in the Veneto region where almost the entire population has been tested, which suggests that the elderly are not only at greater risk in case of infection but also more likely to be infected.
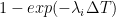
The simulation proceeds in steps of 6 hours each: at each step, the model calculates for each individual the probability that he or she was infected during that step, then randomly determines whether he or she was infected based on that probability. The infection of an individual 


 Furthermore,


I know this equation is going to freak out a lot of people, because mathematical symbols are scary, but I assure you that it’s not complicated if you take the time to study it carefully and to study the description of the parameters. But if you don’t have the time or if you’re not interested in that kind of details, it doesn’t really matter. The important thing to remember is that the model assumes 3 potential sources of infection: at home, at work or at school and in the community, i.e. in the street, at the supermarket, etc. Each term in the equation corresponds to one of those sources. Thus, the sum in the first term includes only individuals in the household of 
Strictly speaking, a subscript 


How much can we trust the model’s predictions? The problem of the universe of possible hypotheses
First of all, it seems to me that one crucial aspect of the model does not make a lot of sense, namely the fact that it assumes that each of the 3 potential sources of infection is equally active at any time of the day. This is obviously not true since, for instance, people cannot be both at home and at work at the same time, except of course for those who work from home even in normal times. It would have been easy to take this into account by multiplying each term in the equation by one or more terms that go to zero at certain times of the day. This could be done with very little computational impact by using a simple modulo operation. For example, one could divide the day into 3 with steps of 8 hours each instead of 6, then assume that only contacts at home are likely to result in infection during the first and last step of each day, while only contacts at work or school and in the community are likely to result in infection during the mid-day period. I think it would be more realistic and, since there would only be 3 steps per day instead of 4, the simulation would probably run even faster. Another possibility would be to use data from time use surveys to estimate how much time people spend in each of the 3 environments during each of the 3 or 4 periods of the day and multiply each term in the equation by the proportion corresponding to each period.
Anyway, maybe an epidemiologist reading this will chime in and tell me what he thinks, but it’s not very important. This example is just a way for me to illustrate how many modeling choices, both in terms of how to specify the model and in terms of how to parametrize it, that could significantly affect the results but are more or less arbitrary must be made to carry out this kind of exercise. In addition to the different ways in which the model is specified, there is a very large number of assumptions about the parameters that enter into these simulations and, although the authors of the study did a sensitivity analysis by varying some of them to see how it affected the results, they varied only a very small number of them and it’s impossible to know how the results would have been affected if they had tried to change other parameters. Indeed, there are infinitely many combinations of parameters that are plausible and, as I noted earlier, running such complex simulations requires huge computational resources and is very time-consuming (according to supplementary notes of another paper from the same team I mentioned above, the simulations for the United States required 20,000 processor hours), so you can only run the simulation for a small number of possible combinations.
While I’m at it, I have seen a number of people surprised that the report does not indicate confidence intervals, but the supplementary notes in the paper I just mentioned explain why:
It is essential to undertake sufficient realisation to ensure ensemble behaviour of a stochastic is well characterised for any one set of parameter values. For our past work which examined extinction probabilities, this necessitates very large numbers of model realizations being generated. In the current work, only the timing of the initial introduction of virus into a country is potentially highly variable – once case incidence reaches a few hundred cases per day, dynamics are much closer to deterministic. Hence outcome variables such as the cumulative clinical attack rate, or number of antiviral courses needed, varied by less than 0.1% between realisations.
In other words, although the model is stochastic (as we have seen above), the different simulations only differ from each other at the beginning of the epidemic and, once the epidemic has reached a certain stage, the simulations converge and the model behaves in a quasi-deterministic way. Incidentally, this confirms what I explained in my previous post, namely that at the beginning of an epidemic, random factors probably play a big role and therefore we cannot conclude that, if the epidemic spread more rapidly in Italy than in France even though the first cases were discovered at about the same time, it’s because the French authorities managed the crisis better. It’s likely that it was just a matter of luck.
Generally speaking, in a simulation study, the fact that only a small number of parameter combinations can be tested is not necessarily a problem. As long as the value of these parameters is known with sufficient precision, either empirically or because we have a sound theoretical basis for it, it isn’t necessary to test many combinations of parameters. For example, in the case of the simulation models that are used to predict climate change due to greenhouse gas emissions, the equations of the models are often derived from well-established theoretical and empirical results. (Just to be clear, this is not always the case, but I think it’s far more often the case than in the case of epidemiological models.) Basically, we’ve been doing thermodynamics and fluid mechanics for more than 150 years, so we’re beginning to understand that stuff pretty well and most of the equations used in climate models are on a pretty firm theoretical/empirical footing.
On the other hand, and while I’m not an epidemiologist, I fear that, in the kind of models that are used to simulate the spread of an epidemic (especially when it’s a new pathogen about which there is still a lot of uncertainty), you don’t have a really strong basis for choosing the values of many of the parameters in the model. For example, the Imperial College team assumes that if generalized social distancing is used, within-household contacts will increase by 25%. But why 25% and not 50% or even 75%? Again, I’m not an epidemiologist, but I don’t think anybody really knows and, if an epidemiologist tells me that’s not true, he better have some evidence to back it up, because otherwise I will just ignore him. The authors of the study made the assumption that it was 25% because it’s plausible and they had to assume something about this, but they might as well have chosen any other value in the pretty wide range of those that seem intuitively plausible.
The same is true for many other parameters in the model, about which one has to make assumptions that are probably arbitrary to a large extent. It’s quite possible that if different but equally plausible assumptions were made, the results would be fundamentally different. The truth is that we don’t know and we can’t know before we try, but since there are so many plausible combinations of parameters and those simulations require such enormous computational resources, we can’t try all the combinations. Beside, even if we could try all the combinations, what would we do if it turned out that different combinations of parameters that are equally plausible lead to completely different results? There would be no reason to favor the results of some combination of assumptions over the results with other combinations of assumptions. There are far too many degrees of freedom in the specification and the parameterization of the model for this kind of exercise to be truly informative. So I think we can have only a very limited degree of confidence in the conclusions of this study. But to be clear, this does not only mean that its projections could greatly overestimate the seriousness of the situation, it also means that they could underestimate them, even if I find it a bit hard to imagine given how cataclysmic they already are.
The problem of the uncertainty about some of the central assumptions of the model
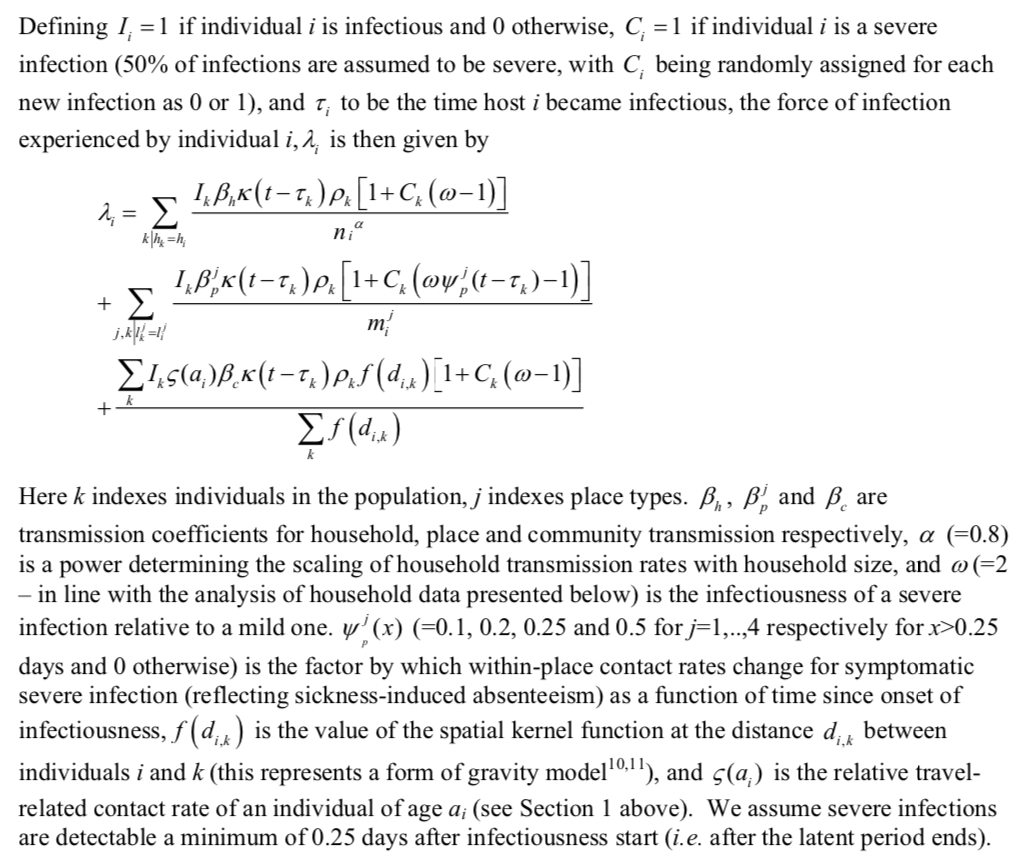
But this doesn’t mean that we can afford to ignore them and I will discuss later the implications that I believe the results of this study should have on public policy. Before I do that, because these simulations paint a completely apocalyptic picture and I want you to really understand that the results could change significantly if the assumptions were modified, I’d like to briefly discuss the assumptions made by the model about hospitalization rates, the proportion of hospitalized cases that need to be admitted to ICU and the infection fatality rate, which I think are probably the most likely to affect the study’s conclusions. The following table presents the model’s assumptions on those parameters by age group: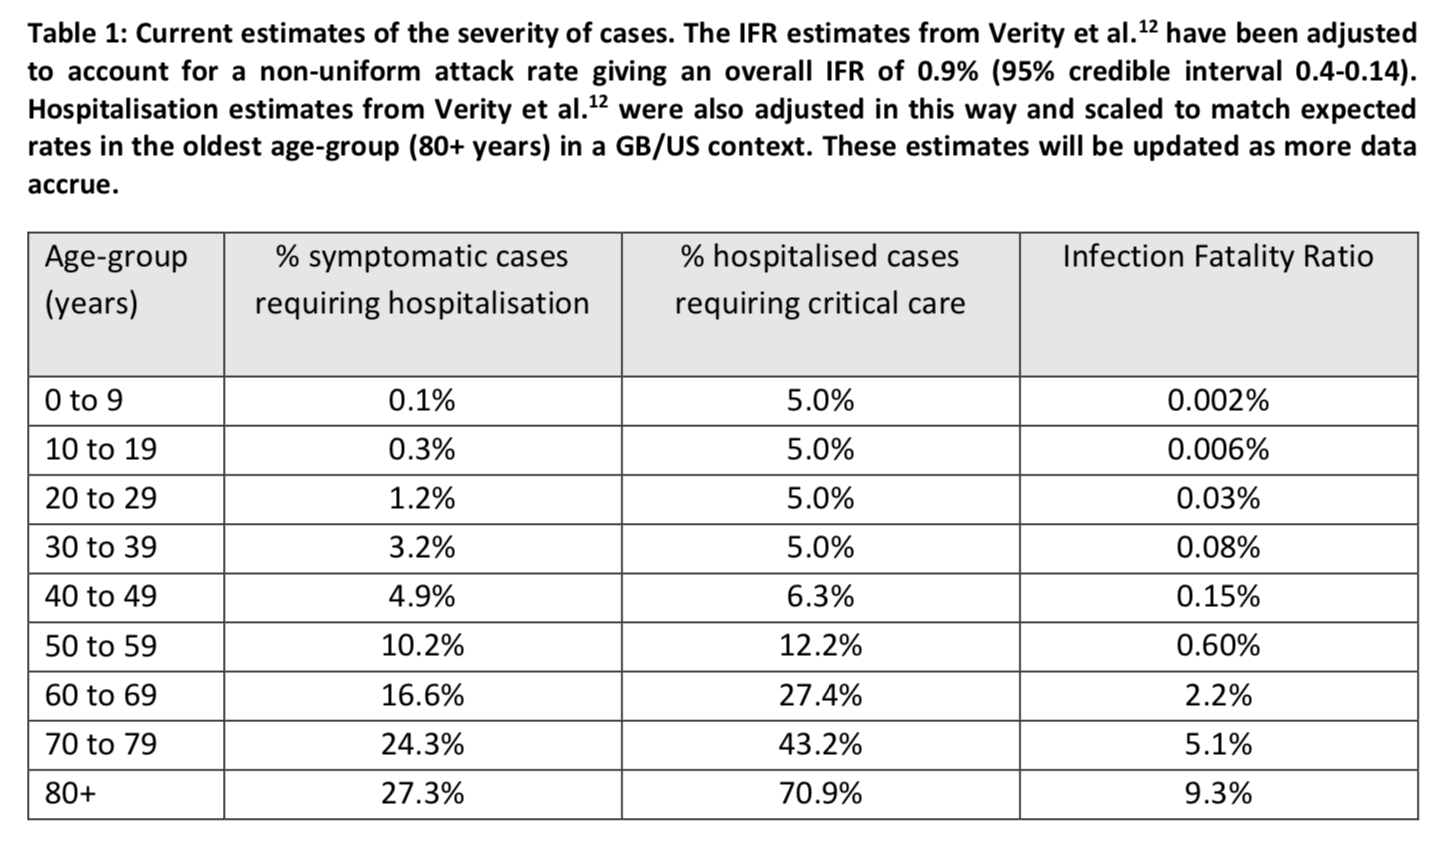 The values in this table are taken from this paper, which is based on mainly Chinese data. The Imperial College team adjusted the values in this study because, in order to estimate the infection fatality rate by age group, the authors assumed a uniform attack rate regardless of age. When these age-specific infection fatality rates are applied to Great Britain, which has a very similar age structure to that of France, the overall infection fatality rate is 0.9%.
Obviously, if the rates in this table are overestimated, the simulations will be much more alarming than what is actually going to happen. The assumptions that are made in this regard are therefore very important, since they are likely to have a considerable influence on the outcome of the simulations from a decision-making point of view. I have only skimmed the study from which these estimates come and, based on this cursory reading, the first concern I have is that the data used seem to be of dubious quality, since in some cases the authors even used information they found in news stories. The study takes into account the fact that a certain amount of time passes between the onset of symptoms and the resolution of a case by death or recovery. It also takes into account the fact that many cases may go undiagnosed and that the proportion of undiagnosed cases varies with age. The authors actually found that the number of undiagnosed cases was very high, with significant differences between Wuhan and the rest of China, as well as between age groups: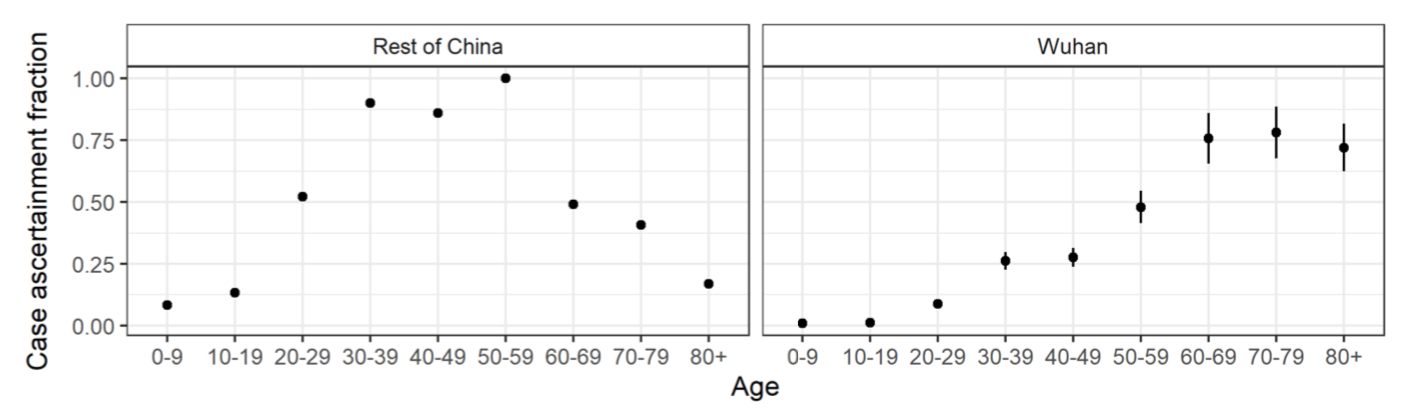 Several other recent studies have found similar results: see this paper in Science, this letter to the editors of the International Journal of Infectious Diseases and this note in Eurosurveillance. Again, I have only skimmed this paper, but my main worry, beside the questionable quality of the data, is that it seems to rely quite heavily on relatively complicated Bayesian methods. Therefore, even setting aside the concerns I have about the quality of the data, if the models are poorly specified or the priors were poorly chosen, the results could easily be biased.
However, judging from the estimates that have been made so far, an infection fatality rate of 0.9% does not seem crazy and may even be close to the bottom of the range. But there is still so much uncertainty about the infection fatality rate that it is difficult to be very confident about any estimate. The enormous variability in case-fatality rates between and within countries over time alone gives some idea of this uncertainty: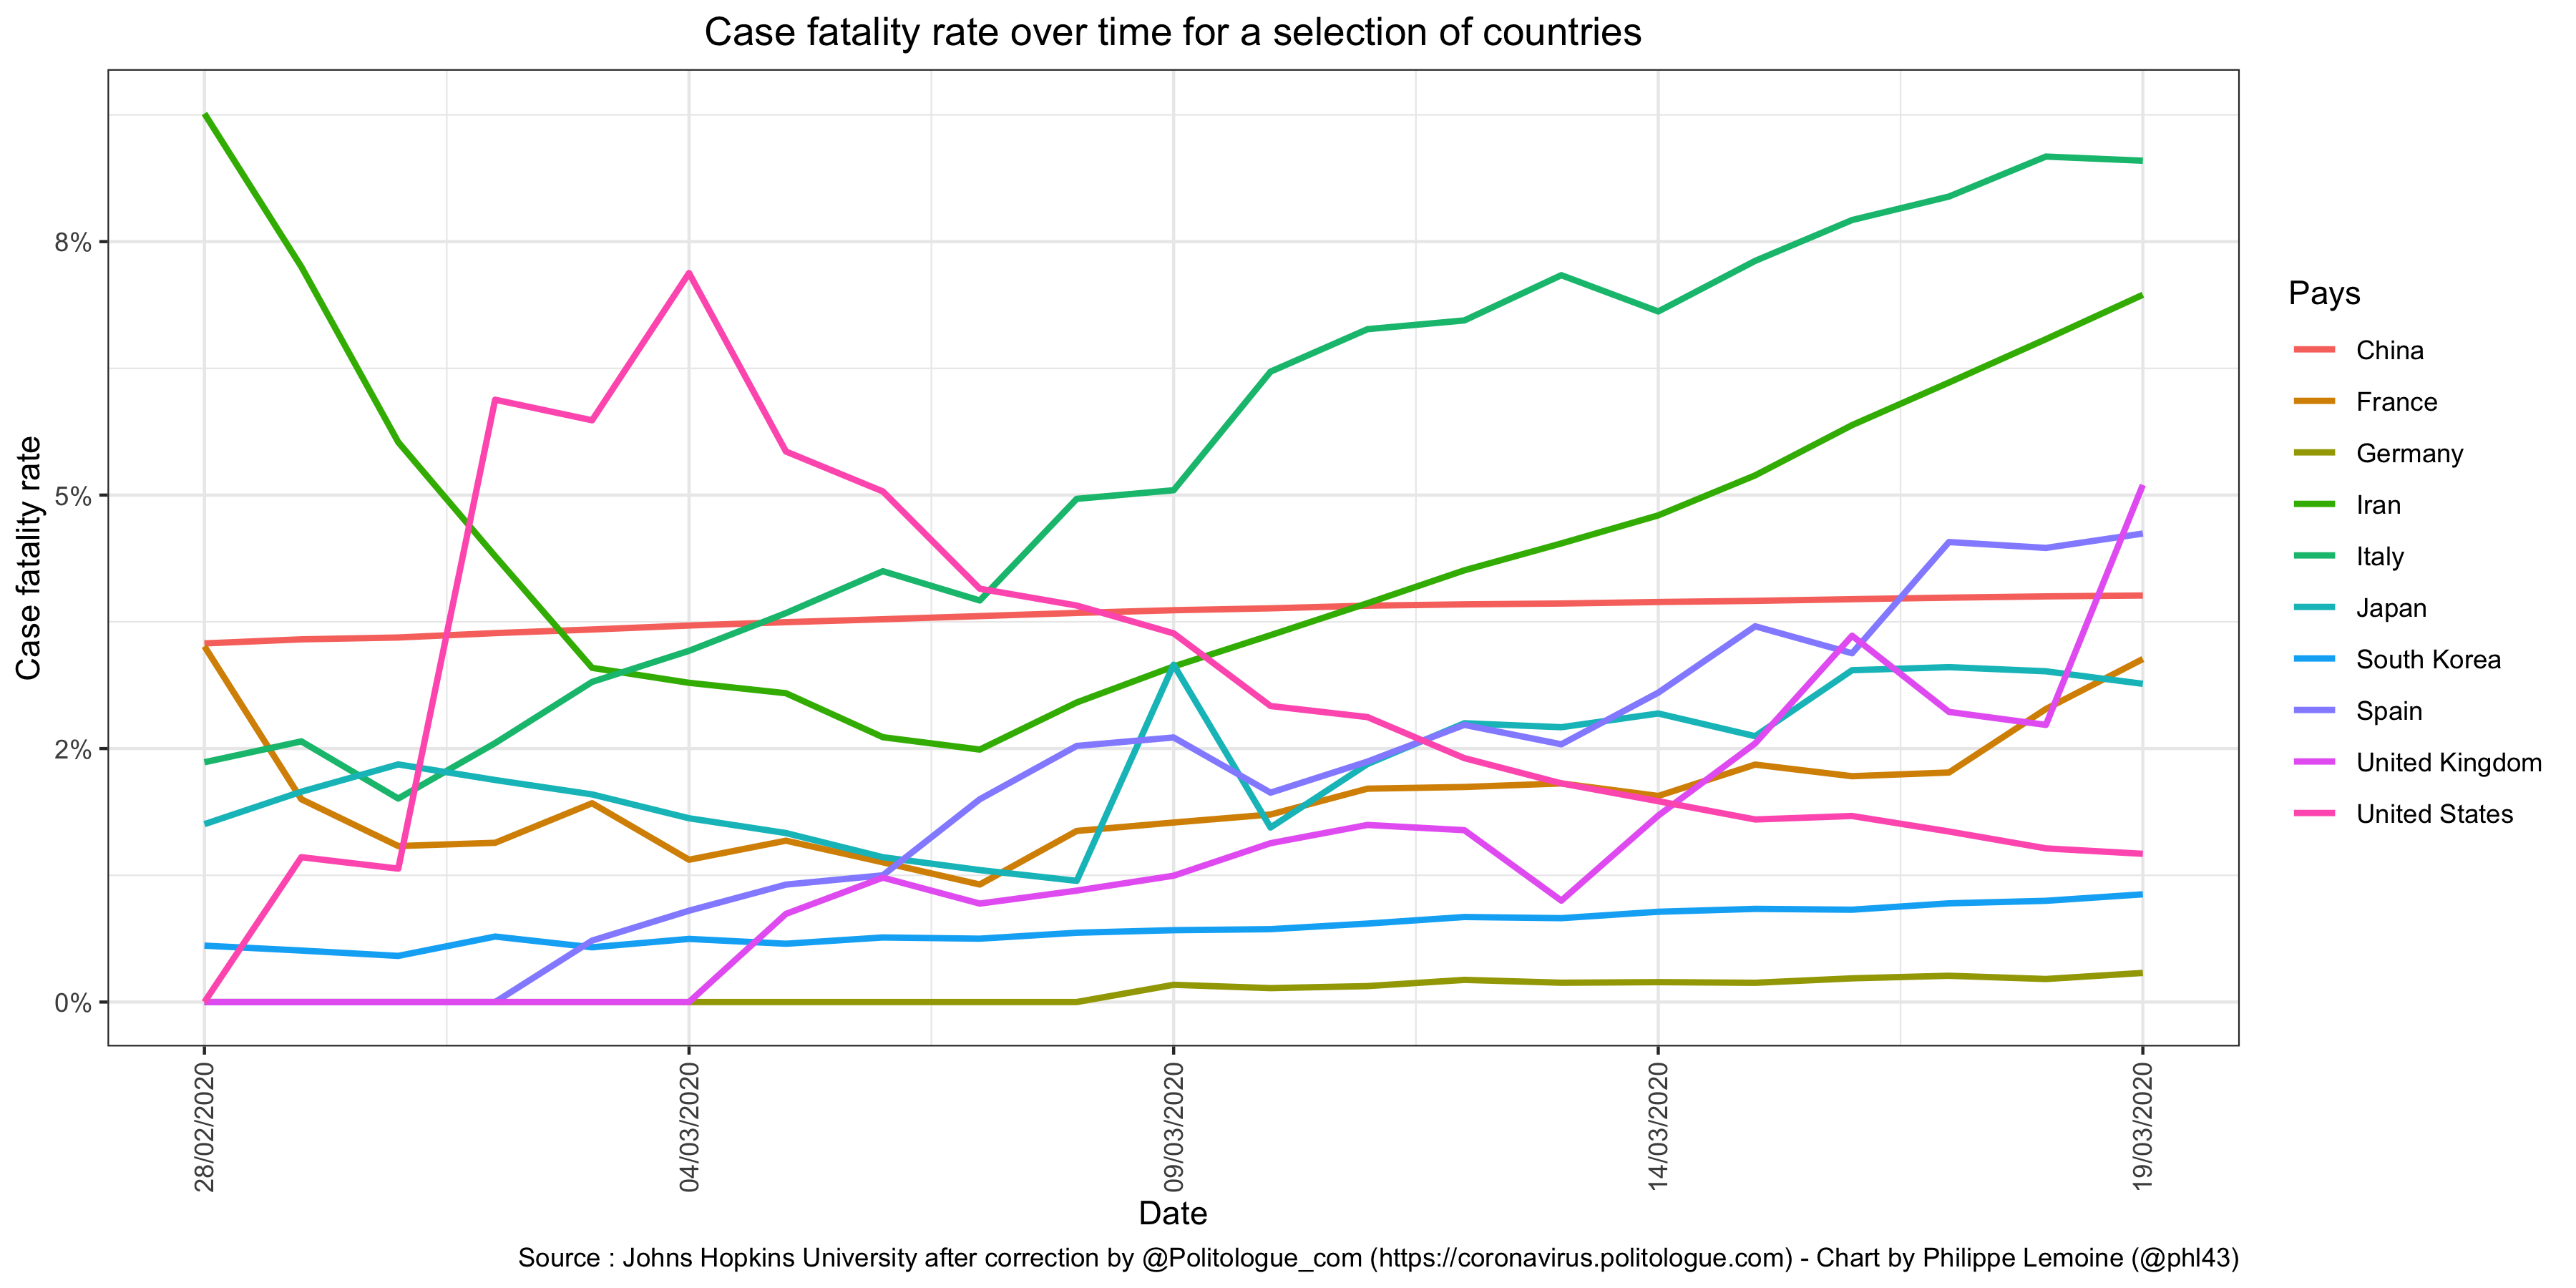 This chart shows only crude fatality rates, without any corrections, but it’s enough to see that the variability is huge even though it would likely be somewhat reduced if adjustments were made.
Clearly, there is a lot of noise in these data, although it’s difficult to know which factors are responsible for it. I don’t think it’s possible to know where we’re headed with this epidemic until we understand why fatality rates vary so much from one situation to another. How is it that the case fatality rate is now over 8% in Italy, while in South Korea it’s still below 1% and in Germany it’s not even 0.3%? One hypothesis that has been put forward and which seems both plausible and consistent with the limited data currently available is that the people infected in Italy tend to be particularly old, while in South Korea and Germany they skew young. If this is true and the epidemic continues to spread, which is not the case at the moment in South Korea, where it seems that the authorities and the population have managed to stop the epidemic, it will probably affect a more representative sample of the population eventually, even though, as I have already noted above, there is evidence to suggest that older people are more likely to be infected. In this case, we must expect the case-fatality rate to increase in Germany and decrease in Italy, unless hospital services become even more overwhelmed than they already are, which unfortunately seems inevitable under this hypothesis. But I find it hard to believe that this is the only explanation for the differences between countries.
Part of it could be explained by the fact that there are huge differences in the number of tests that different countries carry out: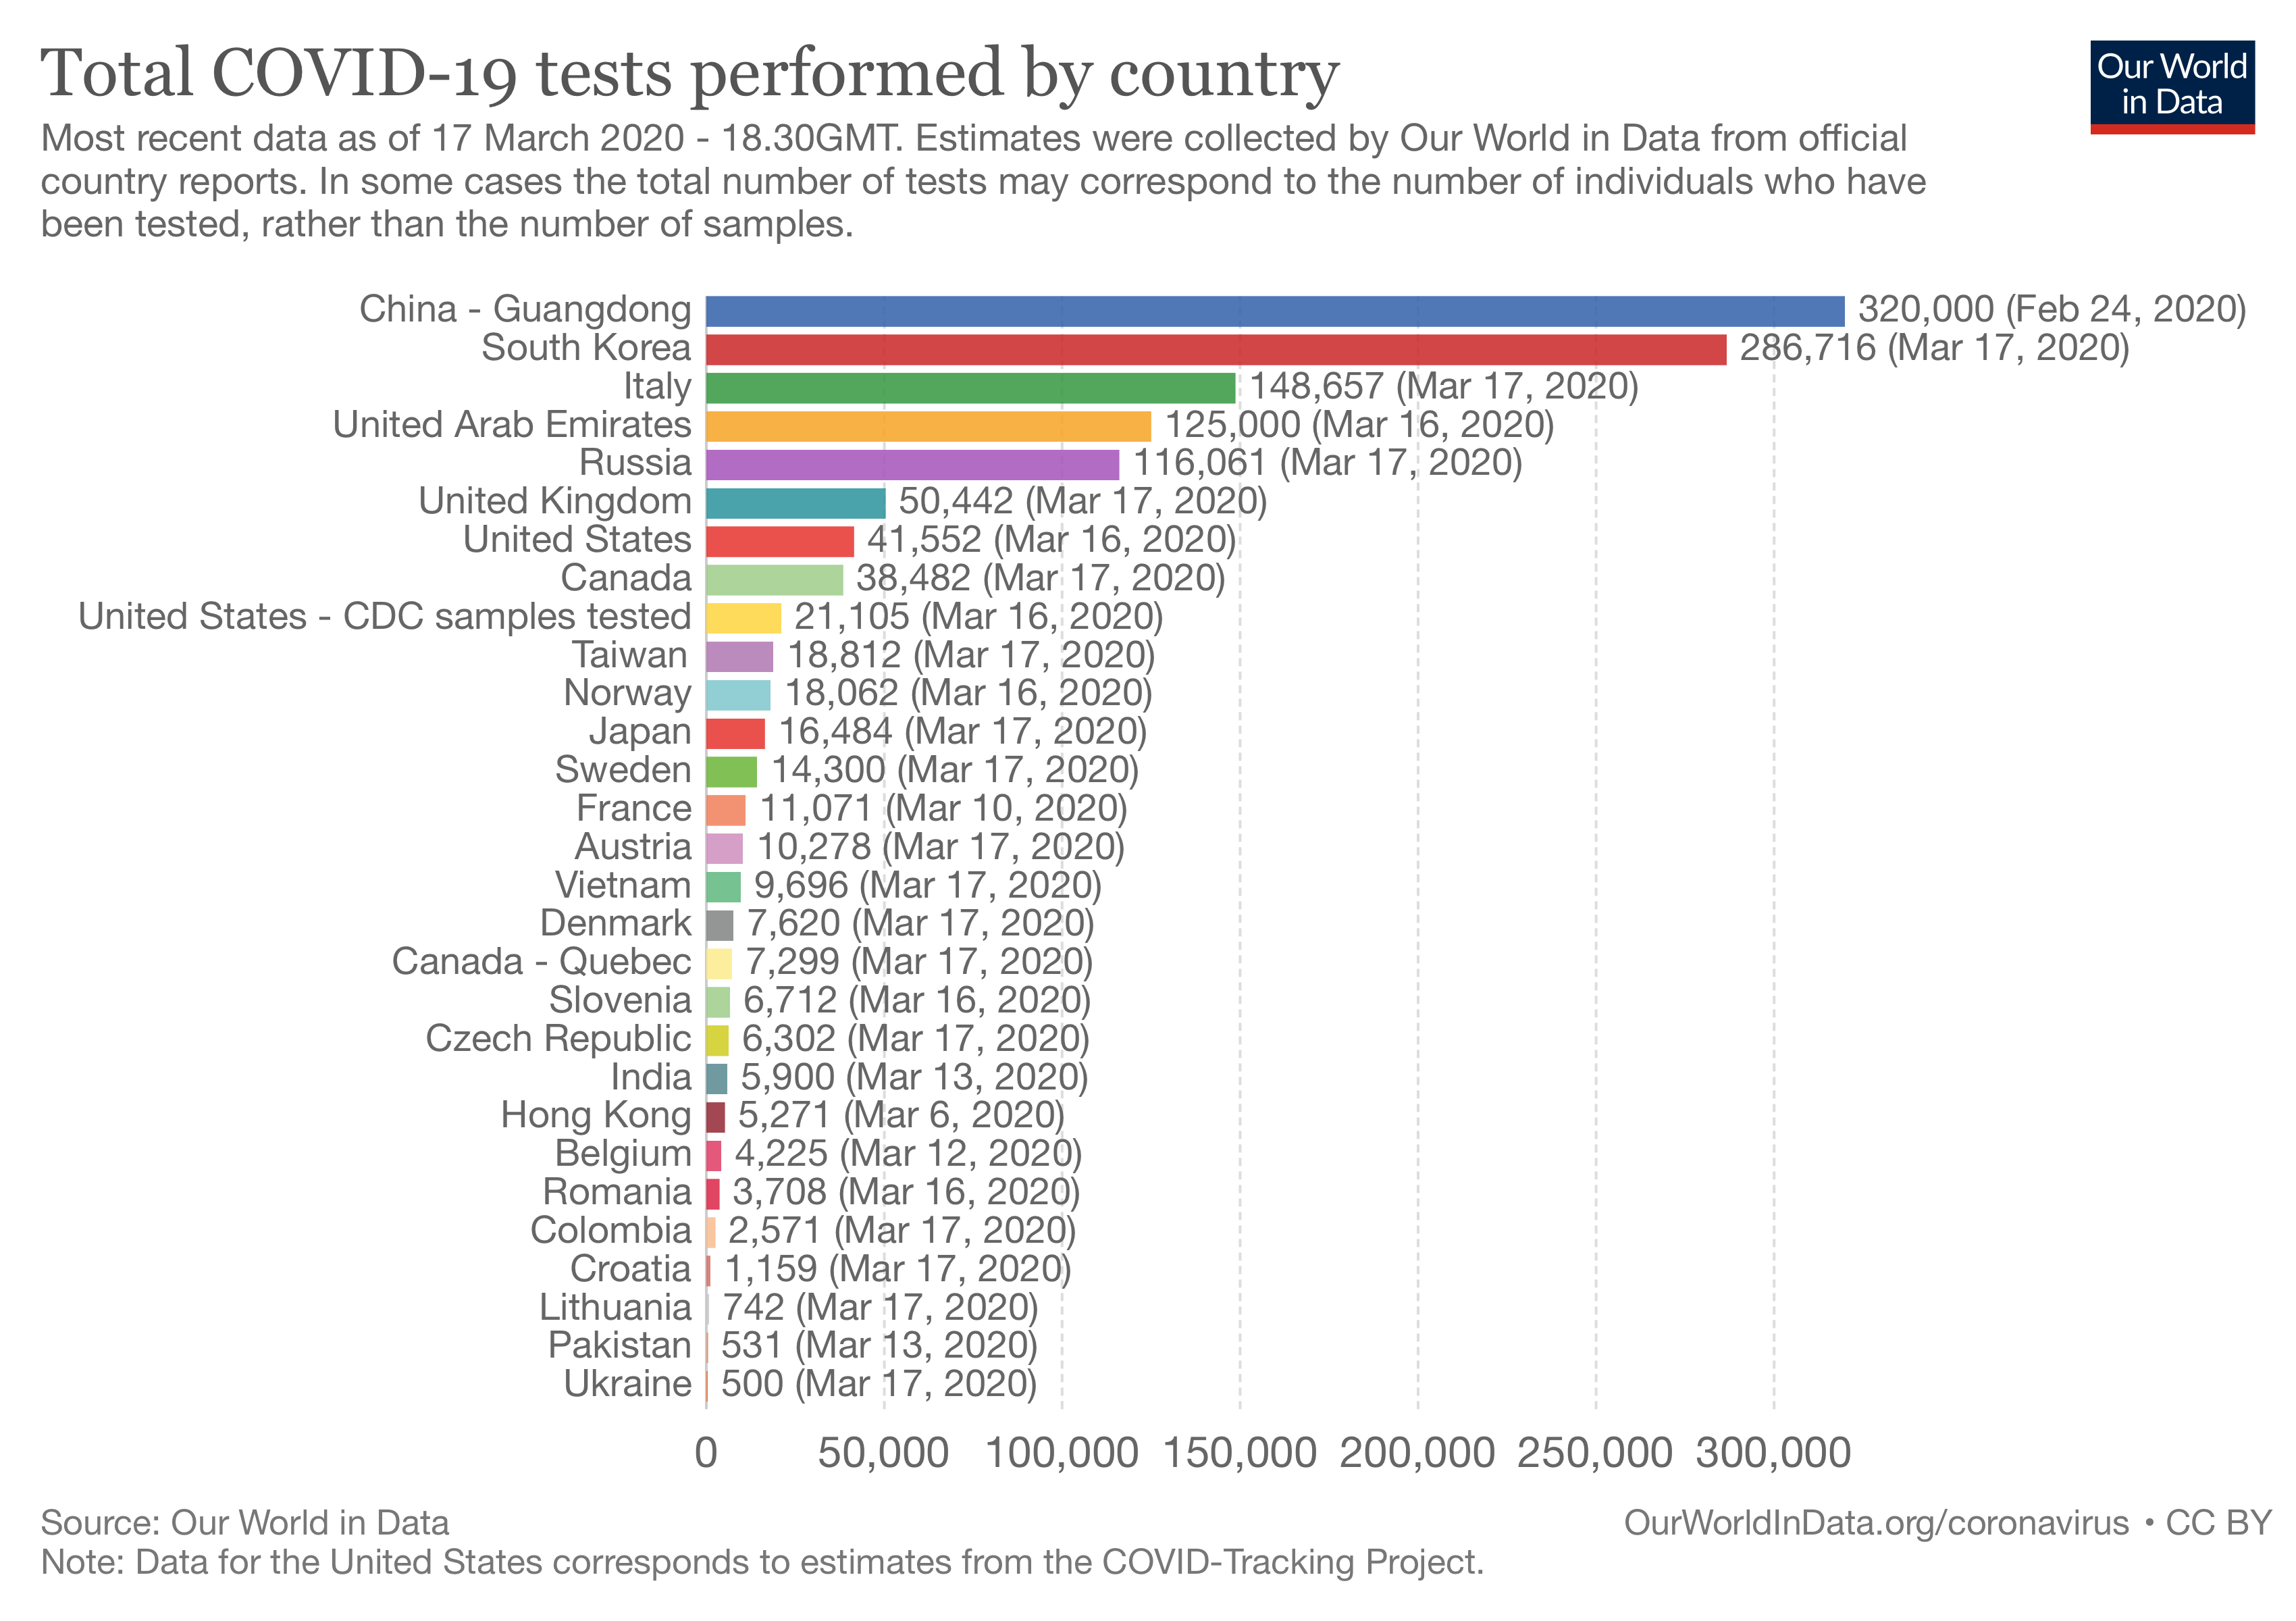 Unfortunately, we have very little data on this, partly because a number of countries, such as France, do not report or only report very irregularly the number of tests they perform.
If only because the number of tests performed varies greatly between countries and even over time within a single country, it seems clear that the data on the number of cases is of very poor quality, which affects the denominator of the fatality rate. For example, I see people rejoicing every time that the increase in the number of cases reported in Italy seems to slow down in comparison with the previous day, but when you make a chart showing the evolution of the number of tests carried out as well as the evolution of the number of cases diagnosed (using the data published by the Italian government every day on GitHub), it is difficult to draw any conclusions: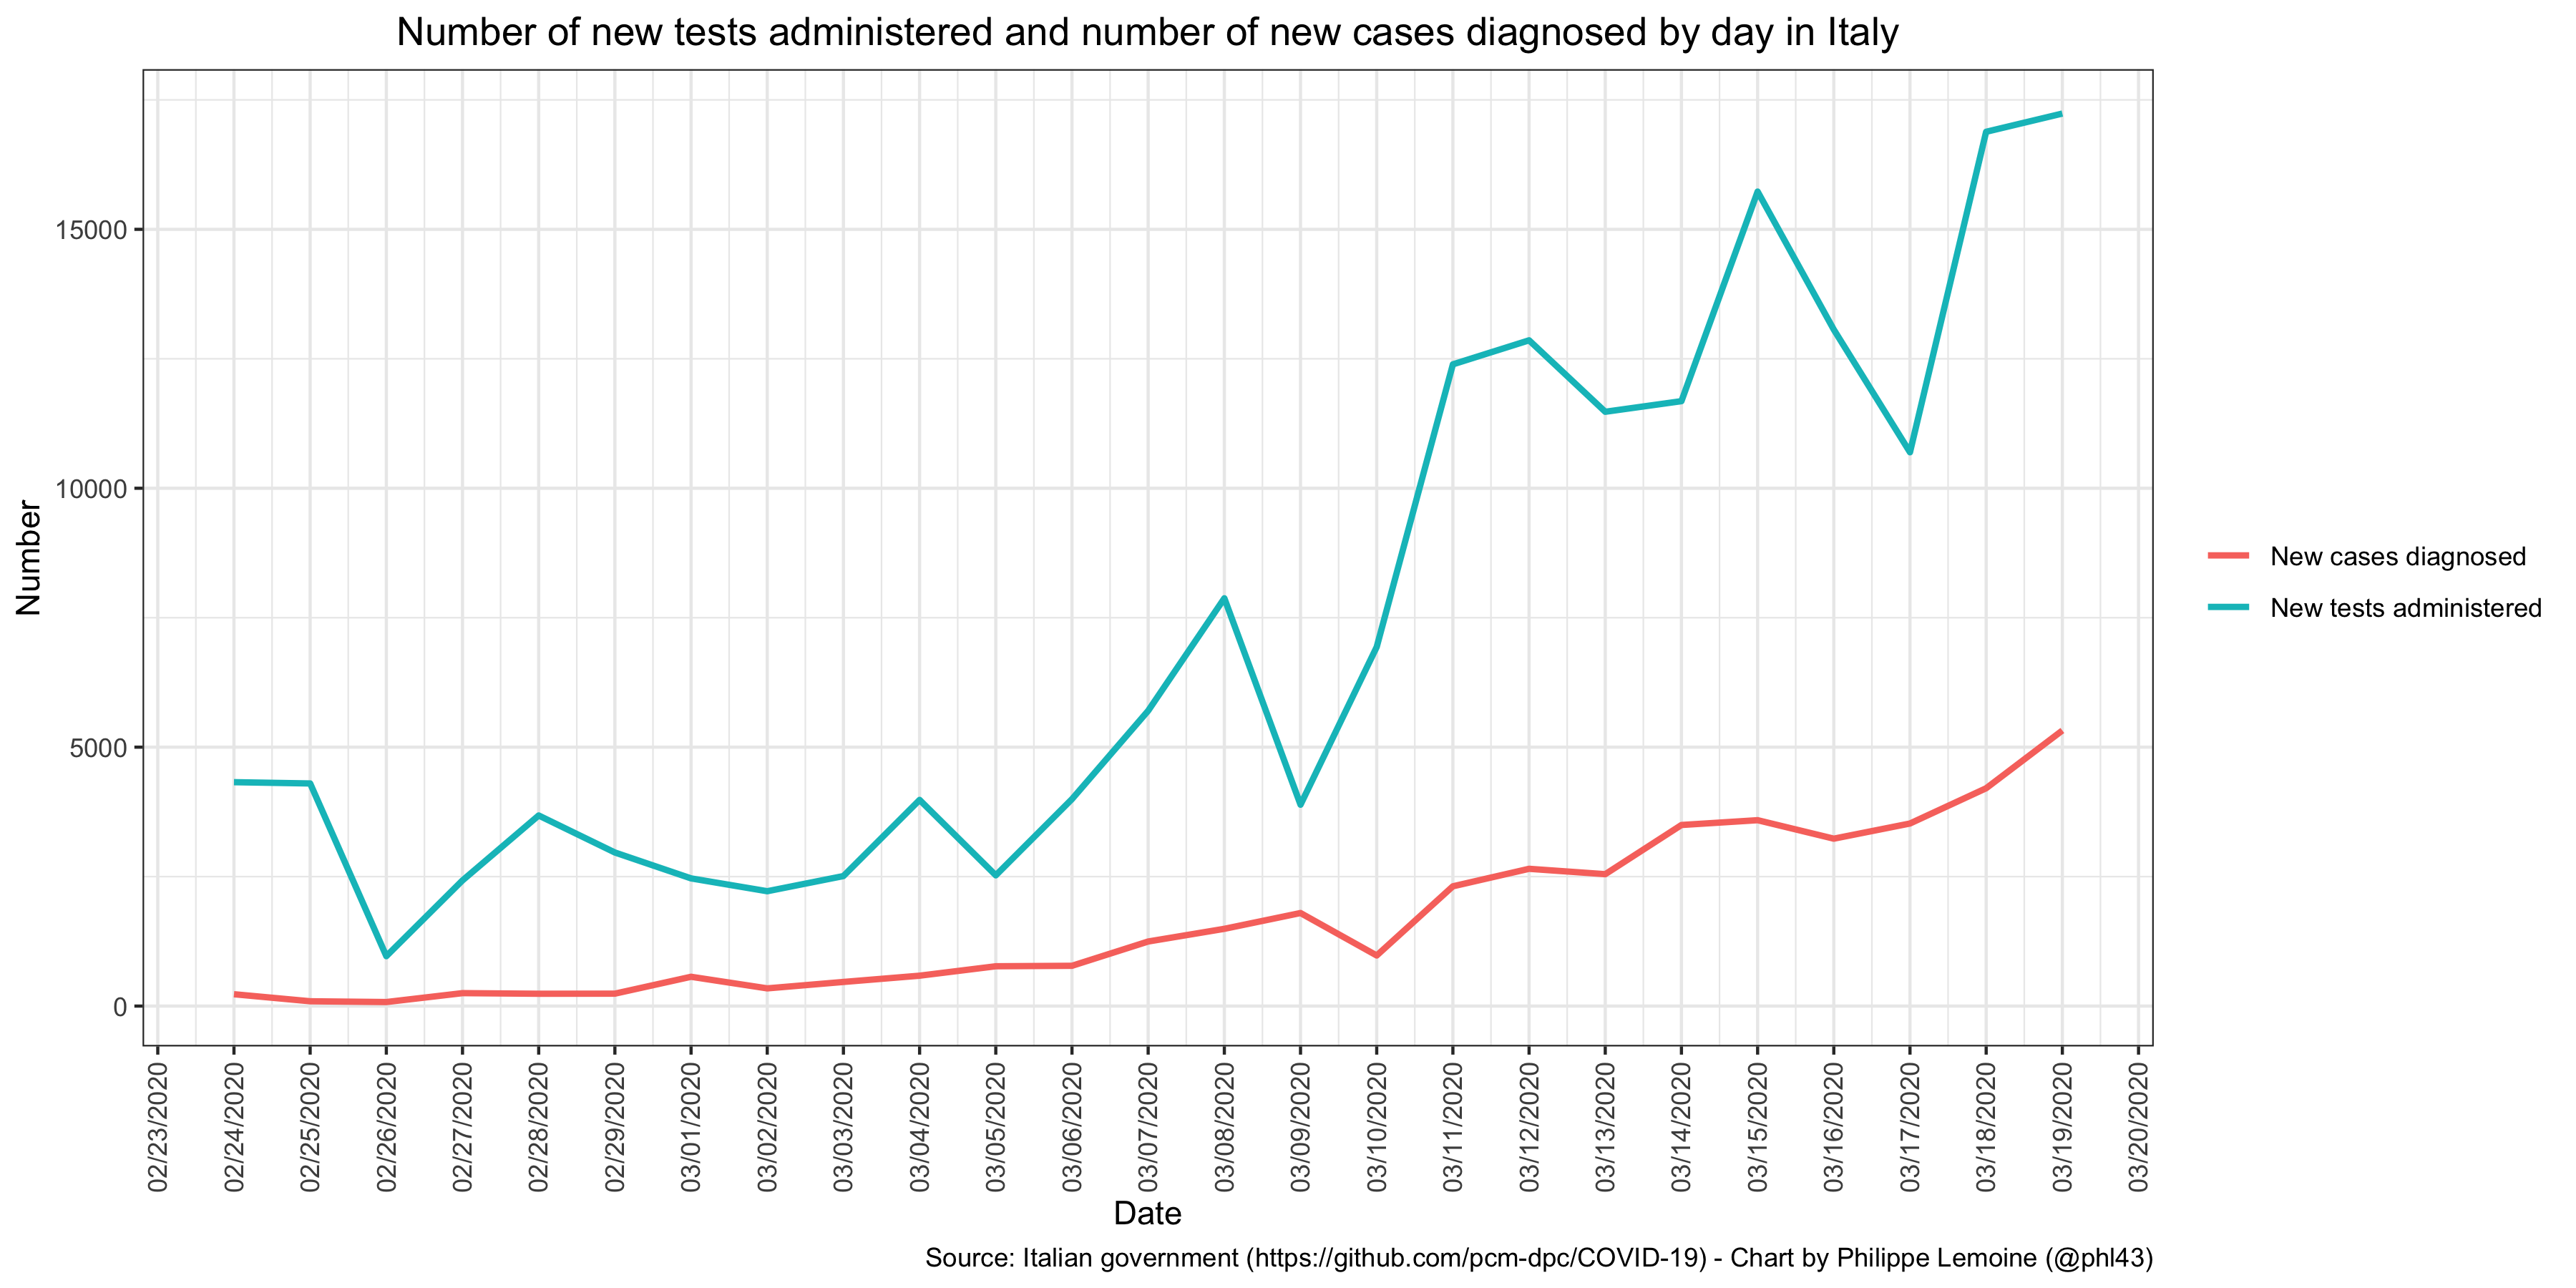 We can see that decreases in the number of diagnosed cases are generally, but not systematically, associated with a decrease in the number of tests administered in the previous days. This suggests that Italy sometimes faces shortages of tests or that the laboratories responsible for analyzing samples are sometimes overwhelmed, which could explain a temporary reduction of the pace at which the number of diagnosed cases increases. Most important of all, despite occasional decreases on certain days which, as I have just explained, are probably due to the lack of tests, a clear upward trend is visible. Furthermore, countries have different policies in terms of who they target for tests and, even within the same country, the targeting policy changes over time. So I think we should more or less ignore the evolution of the number of cases and focus on the evolution of the number of deaths.
The problem is that, even if we only look at the number of deaths, there is also a huge heterogeneity between countries: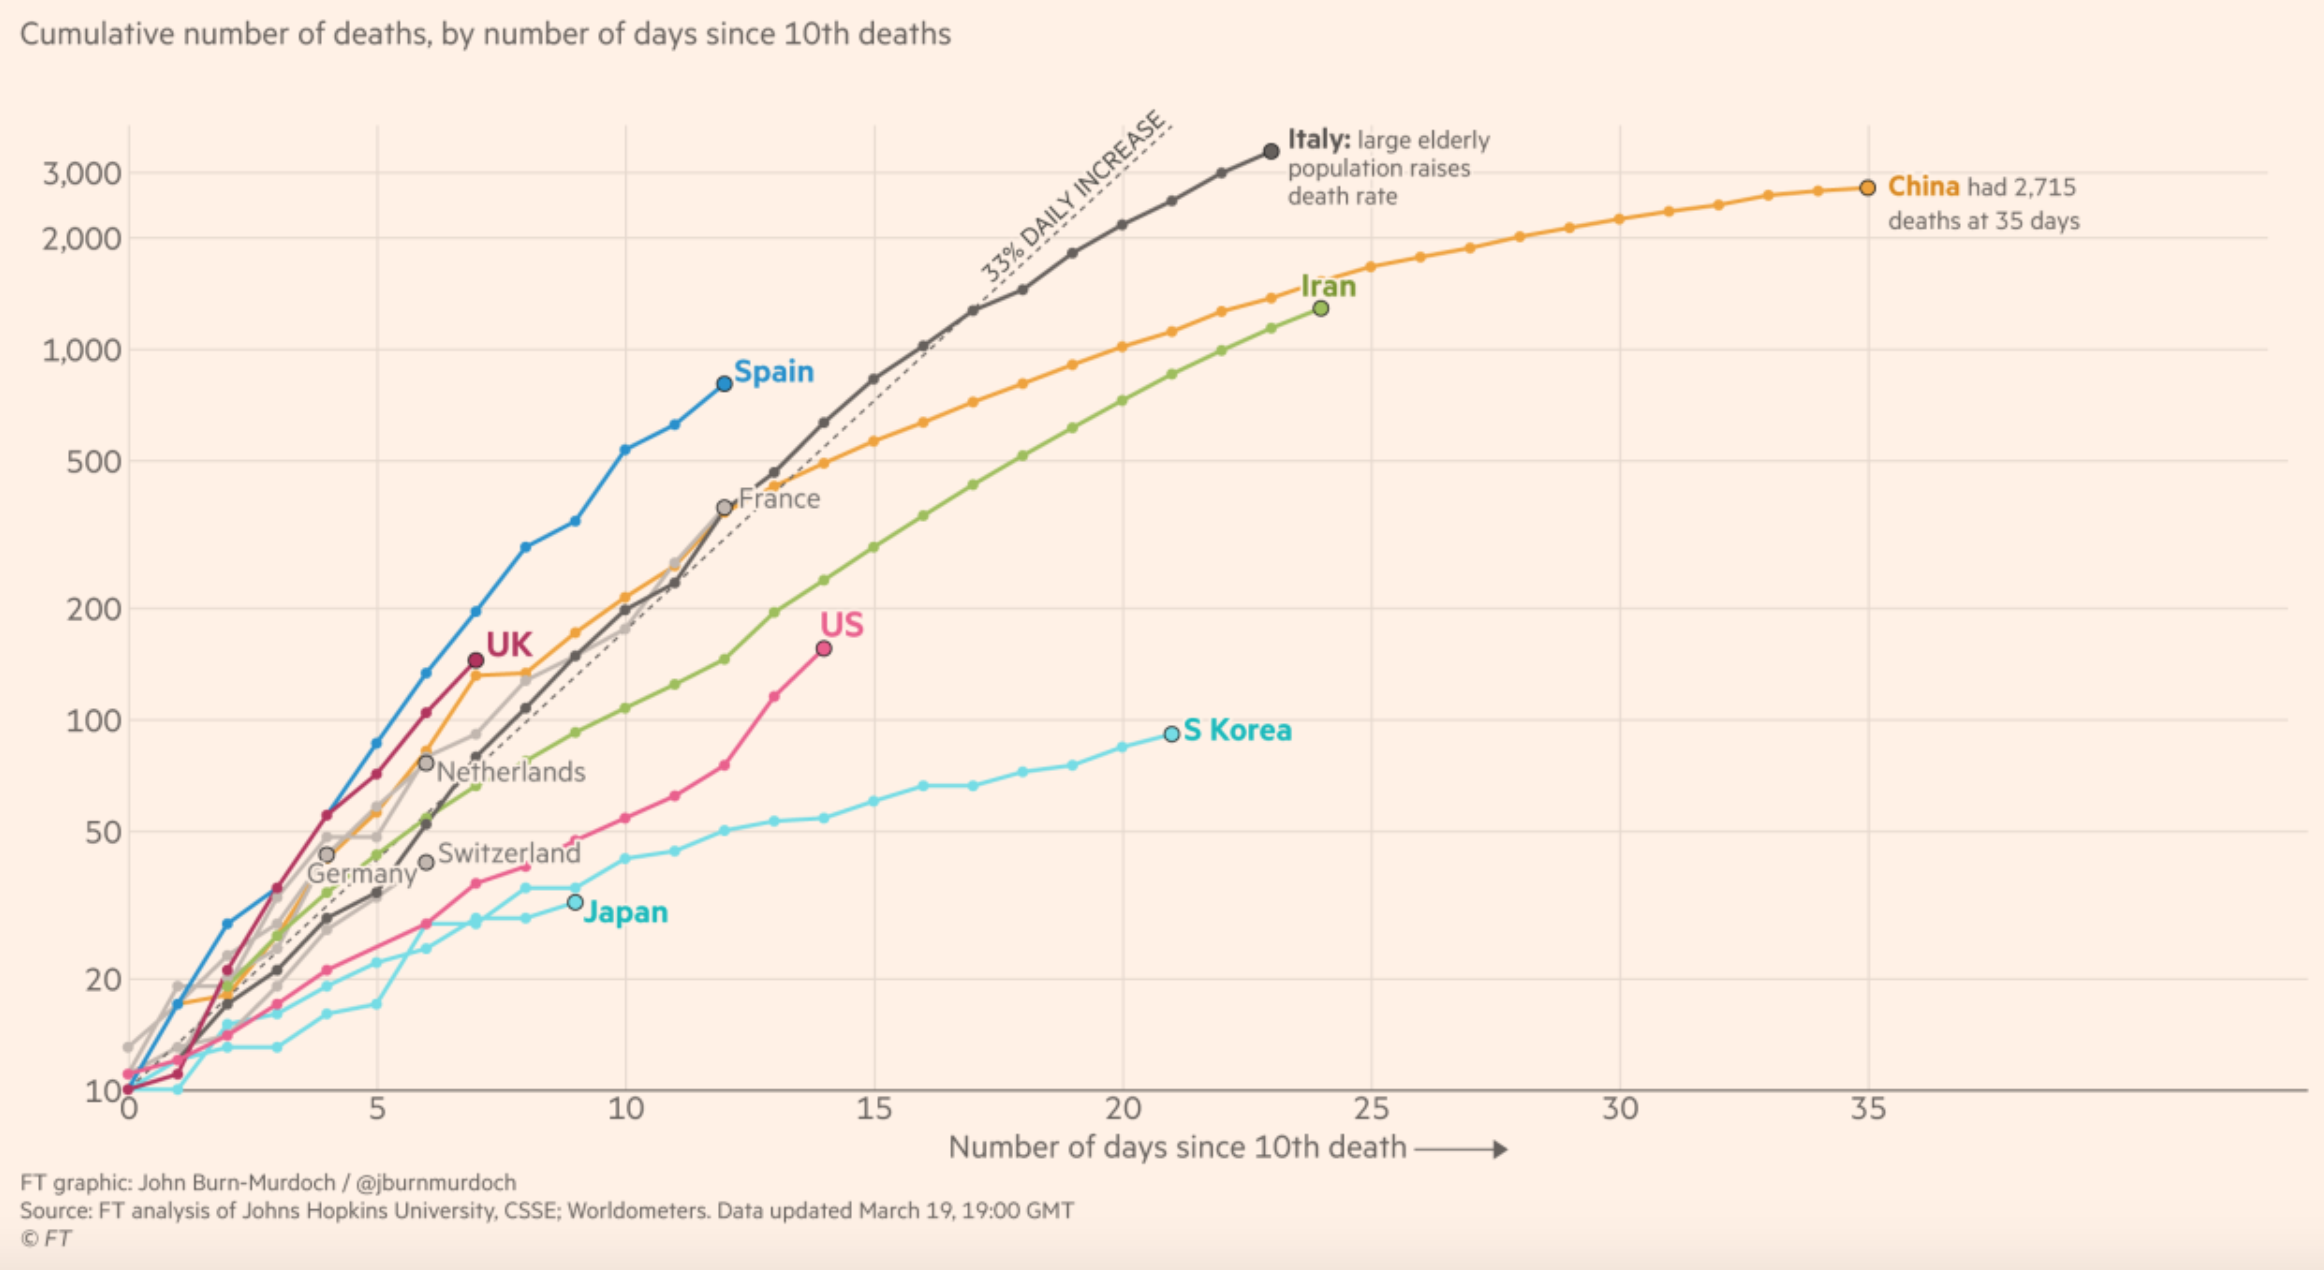 It’s very strange that in some countries such as Germany, South Korea or Japan, there are only a few dozen deaths, while in Italy there are already more than 3,000 and countries such as France or Spain are on a similar trajectory at the moment.
In the case of a country like South Korea, I think it’s plausible that they were lucky at the beginning, since the population initially affected was rather young and after the outbreak was detected the authorities acted very quickly and put in place a policy based on mass screening and isolation of cases that allowed the epidemic to be nipped in the bud before a large number of people were infected. The fact that the number of deaths in China has stopped increasing, after having risen very rapidly at the beginning of the epidemic, could also be explained by the extremely restrictive measures that were put in place relatively early on to stop the epidemic. But that would not explain why, according to official figures, there are so few deaths in countries such as Germany where they test a lot and there are many diagnosed cases and Japan where they test very little and there is only a small number of diagnosed cases. A common assumption is that in these countries there are many deaths due to the coronavirus that are not counted as such by the authorities. As Nassim Nicholas Taleb noted on Twitter the other day, Rasputin was poisoned, shot with a gun, beaten and then thrown into a river, but the cause of death was recorded as drowning . People who defend this hypothesis often quote this interview with an official at the Italian Ministry of Health and this article on the situation, but all this seems anecdotal to me and I think that at the moment the truth of the matter is that we don’t know. However, if this hypothesis is correct, then it shouldn’t be long before we find out, because after a while, if bodies start to pile up, people are bound to notice.
The fundamental epistemological problem posed by this simulation study
The conclusion of this discussion is that, unfortunately, it’ not clear that even the data on the number of deaths are reliable and, in particular, that we can use them to make inferences about the dangerousness of the coronavirus from comparisons between countries. As I see it, there are basically two possibilities:
- The virus is as dangerous as we feared and in particular sends far more people to intensive care than seasonal influenza, but due to a combination of luck in the way the epidemic initially spread, a very aggressive eradication policy launched early enough and/or a climate unfavorable to the spread of the virus, a number of countries have managed to stop the epidemic before it kills many people, while in other countries where these conditions were not present many people have already died and many more will die in the coming months, although sometimes you can’t see that yet because of the criteria used to count the number of deaths ascribed to the coronavirus.
- For some reason, something went wrong in Italy and China at the beginning of the epidemic, which explains the large number of deaths there, but in reality the virus is less dangerous than we feared and the number of deaths will eventually subside, which is already the case in China and is perhaps beginning to be the case in Italy. The situation will improve in the countries that at the moment appear to be on course to follow Italy’s trajectory and the number of deaths will not suddenly explode in those where it’s still low. Similarly, in the countries that now seem to have managed to stop the epidemic or even to prevent it from ever starting, there will be no resurgence or rapid spread of the epidemic in the coming months.
If the first hypothesis is correct, then I’m not saying that the Imperial College simulations are reliable because they’re based on a lot of assumptions in addition to those about age-specific infection fatality rates, hospitalization rates and the proportion of hospitalized cases that require intensive care admission, but at least those assumptions are not crazy and it probably means that we’re at the beginning of an unprecedented health disaster. On the other hand, if the second hypothesis is correct, then those assumptions are far too pessimistic and I think that, regardless of the validity of the other assumptions in the model, the model’s predictions massively exaggerate the danger.
Up until 10 days ago, hardly anyone was taking this epidemic seriously, which was driving me crazy. That’s why I ended up writing a post about the threat and staying up all night to finish it quickly. But today I’m afraid that many people suffer from a kind of groupthink that goes in the opposite direction and from a confirmation bias that makes them consider only the data that support the pessimistic scenario. I see this on Twitter where, when I share information that suggests a pessimistic scenario, it’s retweeted and discussed with a lot more enthusiasm than when I share more reassuring information. I really believe that, even though few would be willing to admit it (including to themselves), many people want this epidemic to turn into a catastrophe. For people who sounded the alarm at the time when hardly anyone took it seriously, there is probably the fear of appearing to have been too alarmist in retrospect, while for many people, including those who until recently thought there was nothing particularly alarming about this epidemic, perhaps the boredom of modern life explains this phenomenon. Truth be told, I don’t really know, but I’m convinced the phenomenon is real. I know that now that I say this, some people will accuse me of being in denial about the problem, but I hope they will remember that just a few days ago most of them were saying that it was just a nasty flu, whereas I was already sounding the alarm.
Just to be clear, I am still extremely worried, to the point that I have hardly slept at all for the last ten days or so because I spent all my time obsessively reading everything I could find about the epidemic and analyzing all the data I can get my hands on about it, but I think it’s important to avoid this kind of groupthink and to think about the situation with clarity. Going back to the main issue of this post, namely what to think about the results of the Imperial College simulations, I want to explain what I think is the fundamental epistemological problem of this study. First of all, it should be noted that, in order to believe that the first hypothesis above is correct, apart from the fact that we have to assume that we’ll soon find out that deaths due to the coronavirus are already piling up in a number of countries such as Germany, even though we don’t yet realize it because of the criteria used to count them, it must also be assumed that the very different, though each very aggressive in its own way, policies that are being used in several Asian countries have been very effective in halting the spread of the epidemic and preventing the number of infections from increasing exponentially.
Many people seem to think it’s obvious that, although the number of deaths is relatively low and/or has stopped growing rapidly in these countries, this is not because the virus is less dangerous than we initially feared, but because the measures taken to stop the epidemic have been very effective. Conversely, I have come across people, far less because optimism has fallen out of fashion in the past few days, who believe that it’s totally impossible that these policies could really explain why the number of deaths is not higher in those countries if the virus were really as dangerous as many estimates of the infection fatality rate and the proportion of cases requiring admission to ICU seem to indicate. For example, Eric Winsberg, a philosopher of science at the University of South Florida who has done a lot of work on simulations and recently published a book on philosophy and climate change, whom I want to thank in passing because the conversations I had with him about the epidemic helped me to avoid the groupthink I was just talking about, objected to me that although the restrictions on people’s freedom of movement put in place by the Chinese government were particularly radical, even the Chinese Communist Party could not have prevented a lot of people from violating the prohibitions. According to him, if the virus really has such a high basic reproductive rate and is really as dangerous as it is said to be, given how huge the Chinese population is, it’s hard to imagine that even such drastic measures as those taken by the Chinese government could have been enough to curb the epidemic. I know some people will say that Chinese statistics cannot be trusted at all, but Eric is not convinced and I’m inclined to agree with him. Furthermore, even if that were the case, one could make the same argument based on the situation in South Korea, where it’s harder to suspect the statistics of being manipulated.
People on both sides seem to think that common sense is enough to determine whether, assuming that the coronavirus is really as dangerous as feared, it’s plausible that the policies pursued in Asia to combat the epidemic explain why the number of deaths in those countries is not much higher, but I do not think that is the case. (This is also how I interpret the argument made by Nassim Nicholas Taleb, Yaneer Bar-Yam and Chen Shen in this paper, in the part where they criticize the Imperial College study because the results imply that it’s impossible to durably contain the epidemic with a policy like that of China or South Korea, but I have not had enough time to think about this. However, see also this other paper by Alexander Siegenfeld and Yaneer Bar-Yam, which I haven’t read yet, but looks potentially very interesting and relevant for this debate). For example, there is no doubt that, despite the very strong measures taken by the Chinese government to restrict the movement of anyone likely to be infected, some of them still have contacts with other people, but still those must be very limited, especially compared to the situation in Europe where containment measures are much less strict. At what point does the level of contact become low enough that it pushes the reproduction rate below the number where it needs to be in order for the epidemic to recede and what measures can be taken to achieve this level? This is simply impossible to say without a reliable model that can answer this question through simulations. However, as long as we are not in a position to say whether the policies adopted by China and South Korea can really explain the relatively small number of deaths in those countries on the hypothesis that the virus is as dangerous as the assumptions of the Imperial College model imply, we cannot say whether those assumptions hold up at least approximately.
The problem is that, in order to know that a simulation model is reliable, you have to know that the assumptions on which it’s based, such as those about age-specific infection fatality rates when patients have access to all the care they need and the proportion of cases that require admission to ICU, are approximately correct. But as I have just argued, in order to be able to know whether the assumptions that Imperial College researchers made about this are approximately correct, we would have to know that their model is reliable! So we are in an untenable epistemic situation, which raises very difficult questions in terms of decision-making: the truth is that we simply cannot know at the moment which of the 2 hypotheses I have stated above is true and, in my opinion, we will not know until we have waited a bit longer, to see in particular whether the number of deaths in countries such as Germany and Japan starts to rise or remains at a relatively low level, but also whether the epidemic is resuming in China and South Korea. Whatever decisions we make right now, and we have to make some, we are doomed to make them under this radical uncertainty. Simulation models such as those at Imperial College may give the illusion that we are not operating under this uncertainty, but it’s only an illusion, regardless of whether the epidemiologists who do these simulations realize it or not.
But what should we do then? Some thoughts on the decisions that have been taken so far, particularly in France, as well as on what should be done now
Given the uncertainty under which I think we operate, the question of what to do is a particularly delicate one, but it’s nevertheless one that cannot be avoided, because decisions have to be made, it being understood that not making any decision is also a way to make a decision. Even if the epidemic quiets down and turns out to be less terrible than we feared, we will face an unprecedented economic crisis, but it will be even worse if we decide to remain locked down until a vaccine or some other pharmaceutical intervention is available. As I explained in my previous post, we cannot ignore the consequences of an economic crisis of this magnitude on the ground that human lives are priceless, which is a completely stupid argument. An economic crisis also destroys lives, even if it does so in a different way than an epidemic.
However, the health risk seems to me to be so enormous if the worst-case scenario were to materialize, which can’t be ruled out despite my criticisms of the Imperial College simulation study, that I personally believe we should shut everything down temporarily, produce tests on a massive scale and create technological solutions to track cases and the people with whom they have been in contact as quickly as possible by allowing whatever resources are necessary for that, then very gradually return to normal life by attempting to systematically detect and isolate all people who have been infected and those with whom they have been in contact for long enough periods of time, keeping ourselves ready to stop everything again if we see that we are once more losing control. We must use the respite that such total containment would give us, which would have to be much more rigorous than at present to reduce the risk that hospital services be overwhelmed during this period, to redirect as many resources as possible to producing tests on such a massive scale that we will be able to test almost the entire population in a short period of time as soon as possible. I don’t think the economic cost of such a strategy will be much higher than if we continue to take half-hearted measures, but on the other hand, if the worst case scenario were to pass, this strategy could save hundreds of thousands of lives, if not more than that, in France alone.
In any event, I would not like to be in the shoes of those who have to make these kinds of decisions right now, but to avoid any misunderstanding, this does not mean, far from it, that I absolve the government for its totally disastrous handling of the crisis. It’s absolutely astounding that, despite the time we had to observe what was happening in the countries that were hit before us and prepare ourselves accordingly, it took us so long to react. Given the advantage that we had over so many other countries, it’s unacceptable that we now lack such essential things as masks for our health care workers, tests to detect infected people and so on. Personally, after what has happened and whatever happens next, I cannot see how Macron could remain in place when it’s all over. I don’t want to spend a lot of time on that issue in this post, because now is not the time and it’s already very long. But whatever happens from now on, we must not forget the incompetence, the repeated lies and the total lack of transparency of the government during this crisis. I will no doubt have the opportunity to come back to this, so once again I do not want to dwell on it, but I do want to briefly discuss the decision to maintain the first round of local elections.
As I explained in my previous post, which I wrote the very night Macron announced this decision, I think it was simply criminal. It’s important to know that, according to this article in Le Monde, the president made this decision on the same day that the results of the Imperial College simulations were presented to the government. Now, although I don’t think we can trust the results of these simulations (as I explained above), even if the model predictions overestimated how bad the epidemic was by a factor of 4 or 5, the consequences would be so catastrophic that making this decision at the time made absolutely no sense. (Indeed, this is actually a point that the Scientific Council had noted in its advice to the government of March 12, making explicit reference to the results of the simulations by the Imperial College team.) There was no need for a complicated model to understand this, simple common sense was enough. As I said at the time, everything already indicated at the time that we were on an Italian-style trajectory. Indeed, the situation in Italy was already very serious back then, so you did not have to be a fanatical proponent of the precautionary principle to understand that the elections had to be cancelled.
Before I conclude, I just want to respond briefly to 2 arguments that we hear a lot, from people who are still defending the President’s decision. First, they say that going to a polling station does not present a much greater risk of infection than going to a supermarket to buy groceries, so there was no reason to postpone the election because people were not going to stop going to the supermarket anyway. This is the government’s argument, which claims to be based on the Scientific Council’s opinion that I mentioned earlier. Here is what the opinion in question says on this point:
The Scientific Council has been questioned about a possible postponement of the election. It stressed that this decision, which is eminently political, could not be left to the Scientific Council. It considered that if the elections were to be held they should be organized under appropriate sanitary conditions (in particular respect for distances between voters, disinfection of surfaces, provision of hydro-alcoholic gels, spreading of votes over the day, no post-electoral meetings, etc.). Under these conditions, it did not identify any scientific argument indicating that people’s exposure would be greater than that linked to essential activities (shopping). The Scientific Council alerted the government to the fact that, from a public health point of view, it was important for the credibility of all the proposed measures that they appear to be devoid of any political calculation.
Before I go on, it should be noted that, contrary to what the government suggested, the Scientific Council did not in any way say that maintaining the local elections was safe and it explicitly refused to rule on this issue, which it rightly considered to be politically motivated. But it’s also important to note that it did not say that holding the elections was safe and, in particular, that it’s absolutely not a logical consequence of the passage I have emphasized. Indeed, as I understand this passage, it says that, for people taken individually, the risk of infection in a polling station was no higher than in a supermarket. But it does not follow in any way that, for the population taken collectively, maintaining the elections did not significantly increase the risk of the epidemic spreading and it’s actually obvious that this was the case for at least 2 reasons.
First, even if the probability that an individual is infected because he goes to a polling station is not greater than the probability that he is infected because he goes to the supermarket to buy groceries, it’s quite obvious that the probability that he is infected if he does both is greater than if he just goes to the supermarket to buy groceries. Similarly, someone who goes to the supermarket twice a week is more likely to be infected than someone who goes only once a week. Indeed, if that were not the case, the government would not be asking us today to limit the number of times we go out in order to minimize the risk of being infected or infecting others. This is totally obvious and one has to be a complete idiot not to understand it, but unfortunately I fear that we are being governed by idiots, because even though they lie a lot, I have little doubt that they still believe a lot of the nonsense they are saying.
But the other reason why it’s obvious that not canceling the elections has contributed to the spread of the epidemic is that, beyond the direct effect it has had by increasing contact between people, it has probably also had an even greater indirect effect, because it sent a signal to the population that the situation was not that serious and delayed awareness, hence the scenes of insouciance we saw last weekend. (In this respect, it’s particularly shocking that, according to Le Parisien, the president’s wife said she had been shocked by the number of Parisians she saw walking along the Seine’s banks last Sunday when she herself was… walking along the Seine’s banks.) Most people are very poorly informed, especially since on this subject the media have been particularly incompetent as well (it will also be necessary to take stock of the media’s handling of this crisis when all is said and done), so they largely relied on the government to assess the seriousness of the situation. But how can they be expected to understand when the government decides to maintain the elections, yet on the very eve of the vote announces the closure of all non-essential businesses? The government’s communication was completely unreadable! Moreover, I fear that, by dint of lying or contradicting themselves, people will listen less and less to what it says, when what we need at the moment is for the people to be able to trust the authorities.
Conclusion
I now come back to the main topic of this post, namely the question of what kind of scenario we are heading toward. I argued that you can’t really trust the results of the Imperial College simulations and, even though I had to study the model and think about it in just a few days (I didn’t sleep much recently), so I can’t rule out that I missed something, I really think my arguments on this point are very strong and I doubt that anybody will change my mind. But it doesn’t mean that I don’t think there is nothing to worry about. On the contrary, I think there is a lot to worry about and I’m very concerned, but it’s not because of these simulations, for now that I have studied the model closely, I don’t see why I would take the results very seriously.
But if I’m extremely concerned, it’s primarily for common sense reasons. I see that China, which presumably does not have a government that is prepared to make decisions that have a considerable economic cost lightly, has shut down an entire region whose population is almost equivalent to that of France and has brought the rest of the country to a standstill because of this epidemic. I also see that, right next door to us, the dead are piling up in Italy. Moreover, I see that, according to the data posted daily on GitHub by the Italian government, the number of people currently in ICU because of the coronavirus is now around 2,500: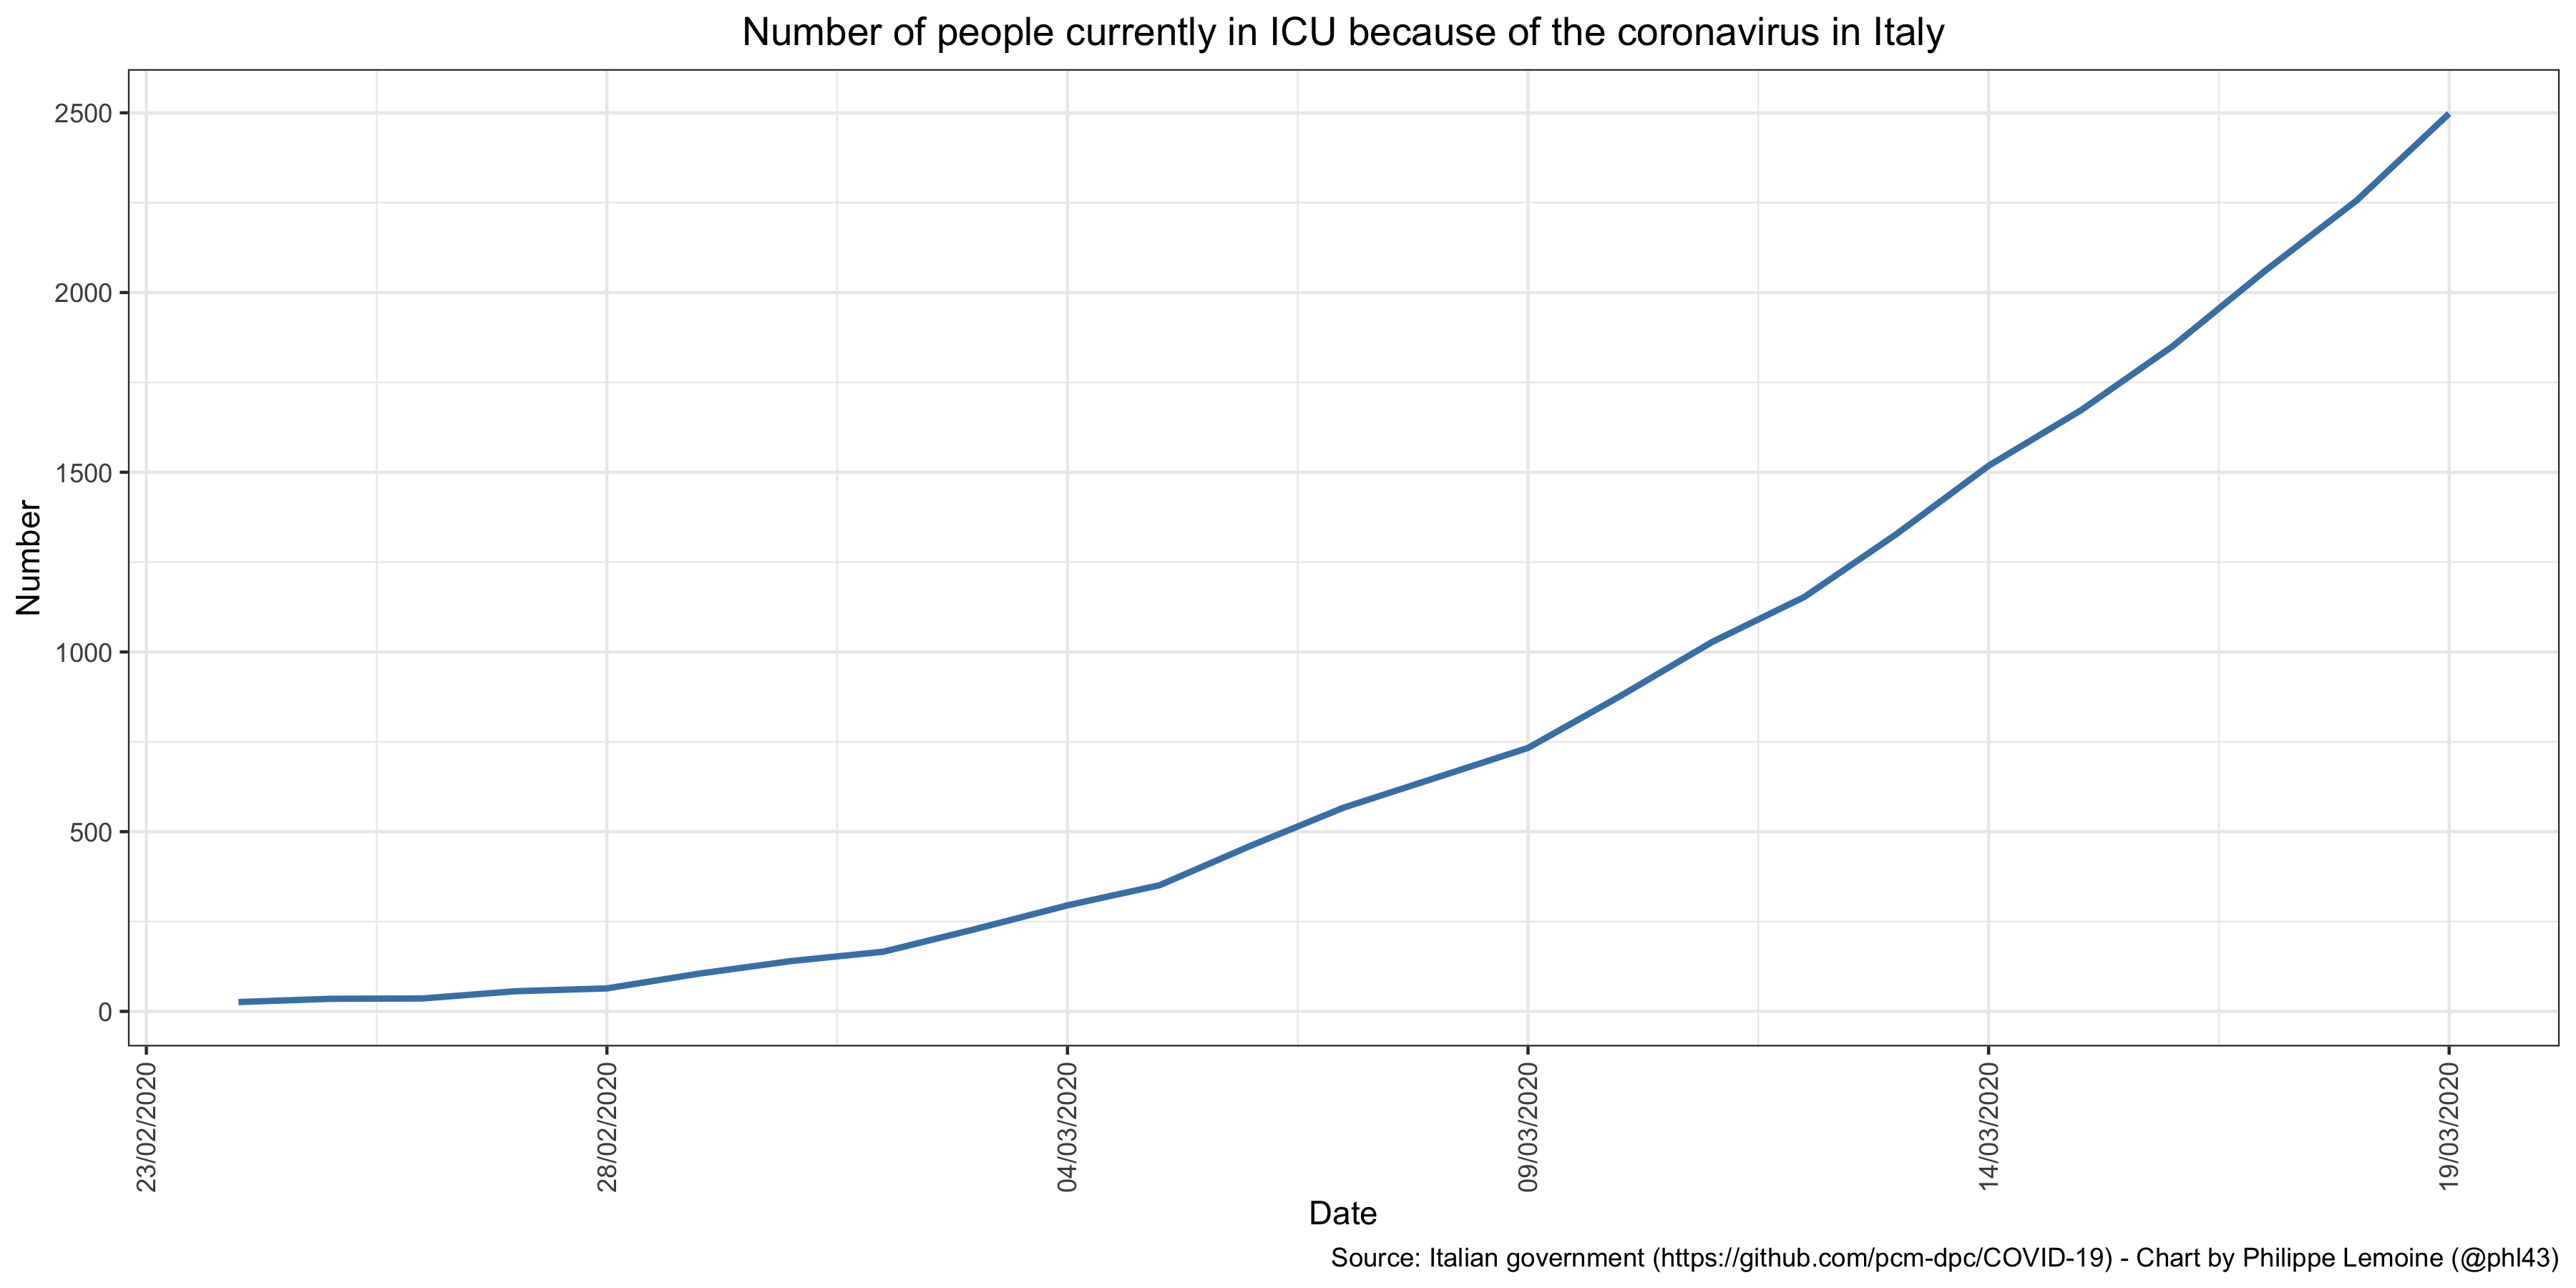 I would like to point out that I have checked and that the data are not cumulative, which means that the people who leave ICU, either because they have died or because they have gotten better, are removed from the data every day.
As I explained in my previous post, the total number of ICU beds available in Italy is about 5,000, though I’m sure they can increase it to some extent. In other words, just with the people who are already in ICU right now because of the coronavirus, Italy has already reached about 50% of its capacity at the beginning of the crisis, even though many beds are presumably needed for people who are suffering from a problem that has nothing to do with the coronavirus. I find this extremely worrisome and I think that one would have to be crazy not to be concerned about it, especially since at the moment it unfortunately seems that France is following a trajectory that is exactly the same or even worse, since on March 19 there were already 1,122 people in ICU because of the coronavirus. Even if this trend only continues for 2 or 3 weeks, we will be in an extremely difficult situation, so I think it would be irresponsible not to prepare for that and even for much worse than that.
At the same time, there are also many things that are difficult to reconcile with an apocalyptic scenario, such as those predicted by the Imperial College study, and even with a scenario that is not nearly as terrible but in which many people die nonetheless. I have already mentioned above some of the evidence that seems difficult to reconcile with a doomsday scenario and even with what is already happening in Italy, France and Spain, so I’m not going to dwell on that, but I think it’s useful to come back to it anyway. Indeed, many people talk about this epidemic as if what is happening were perfectly clear and there were nothing weird going on that would make it difficult to diagnose the situation, but I think it’s completely false and that people are just ignoring anything that does not correspond to a diagnosis they deem without sufficient evidence to be obvious when it’s far from being the case.
Thus, while the situation seems to be taking an increasingly concerning turn in France, Italy and Spain, and we can’t rule out yet that other countries such as the United Kingdom or the United States are on the same path, there are still very few deaths in Germany and several other northern European countries, as well as in Japan and several other Asian countries that are very connected China, such as Thailand. Moreover, there are several cruise ships where there has been an outbreak of coronavirus, such as the Diamond Princess, but it seems that the fatality rate is not particularly high on them given the very high mean age of the people on board. Even in Italy, according to a recent comprehensive analysis of coronavirus deaths so far, the median age of the victims is 80 and a half and 99.2% of them suffered from at least one other disease in addition to coronavirus, such as high blood pressure, diabetes, etc. In 48.5% of the cases, the patient had 3 or more other diseases. These data seem to indicate that the virus mainly kills people who are already in very poor health, which might suggest that the proportion of the population it’s likely to kill is not huge.
That being said, this is not obvious either, because a number of the comorbidities in question are quite common in the population above a certain age. Furthermore, in France, half of the people currently in ICU are under 60, which is much more than in Italy and suggests that the virus could also be dangerous for a significant number of people who are not especially in poor health. Moreover, although I agree that the low number of deaths in countries such as Germany and Japan is difficult to reconcile with the assumptions that many people make about the dangerousness of the coronavirus, it would also be very strange if, for reasons that have nothing to do with the intrinsic dangerousness of the coronavirus, the number of deaths and people in ICU exploded precisely at the time of this epidemic not only in Italy, but also in France and Spain. At some point, it starts to make a lot of coincidences, but it doesn’t change the fact that the situation in Germany, Japan, etc. is what it is and that for now it’s completely different from what we see in southern Europe.
On the other hand, although I myself have been critical of comparisons with the flu when everyone thought the coronavirus was no more dangerous than a bad flu, and to be clear I still think I was right, I discovered things when I looked at the estimates of the number of deaths each year from the flu that make the situation even more complicated. Indeed, according to estimates by the French agency for the protection of public health, the flu was responsible for 13,000 excess deaths during the 2017/2018 season. However, it’s important to understand that this figure is obtained by using a statistical model of the type described in this paper, which estimates the number of people who got the flue and died during this period but would not have died had they not had the flu, using data from the administration on the number of deaths, data on the number of general practice visits for influenza reported by doctors and a number of other things. Therefore, it’s not comparable to the number of deaths that have been attributed to coronavirus to date, especially since, to be honest, and even though I haven’t really studied the model, I think it’s better to take that estimate with a grain of salt, because I have no idea how reliable the model is and this estimate is not something that can be easily verified since we have no baseline.
But the epidemiological summary from French agency for the protection of public health also reports that during the same period 2,915 serious cases of flu were admitted to ICU, 490 of whom died. These figures are much more comparable to those we have for the coronavirus, but they are still not quite comparable. There are probably a lot of people who die from the flu at home or in nursing homes, but who have never been admitted to ICU because of it. I have no doubt the same thing is also happening with the coronavirus and there are even articles in the press like this one that report potential examples of this phenomenon, but given the novelty of the coronavirus and the panic it has finally caused, it seems obvious that cases of coronavirus are much more closely monitored and that the probability that people who die of it have been hospitalized and have gone to ICU is much higher than in the case of people who die of the flu. What is the ratio of the probabilities? I have no idea and, truth be told, no one does. I think it’s all the more true that little is known about the criteria used to attribute deaths to the coronavirus in different countries.
There is no doubt in my mind that we’ll get above 490 deaths because of the coronavirus in 2-3 days at the most in France. [Note: I’m translating this 2 days after I wrote it and we’re now at 562 deaths.] But if one makes the hypothesis that the probability ratio is 5, which frankly does not seem crazy at all to me (even if once again no one really knows), it will be necessary to wait until we reach approximately 2,500 deaths and 14,500 admissions in ICU before the situation due to the coronavirus is comparable. Unfortunately, when you look at the situation in Italy and the trajectory we’re on at the moment, I think it won’t be long before we reach this level. Therefore, this comparison with the influenza figures rather strengthens my view that this epidemic is much more dangerous than the flu. But if we want to be honest, we have to acknowledge that since we have no idea what the probability ratio is, we cannot be sure of anything. In addition to the other data that are difficult to reconcile with a worst-case scenario that I mentioned earlier, I think this should lead us to exercise a minimum degree of caution.
In short, what I would like people to understand is that the situation is really very weird, that the data we have are difficult to interpret, generally of poor quality and often difficult to reconcile with each other. People who are convinced that the epidemic is going to kill millions of people make a whole bunch of assumptions about why there are all these inconsistencies, which are often quite plausible, but we have to recognize that in the vast majority of cases they are mostly speculative at the moment and not supported by a lot of evidence. After this week’s figures, I now have little doubt that, even in the most optimistic scenario that seems plausible to me, many people are going to die in Italy, France and Spain, as well no doubt as in many other countries where it’s still too early to know whether the situation will follow a similar trajectory to that in Italy. But “a lot of people”, given the uncertainty which I think characterizes the situation, could be a few thousand or even a few tens of thousands as it could be several hundred thousand or even more than a million in France alone. At the moment, I have absolutely no idea. I know there are a lot of people who think they do, but at the risk of making a lot of them angry, I don’t think they know any more than I do. Again, I think the risk of a worst case scenario is enough to suggest the pretty radical strategy I briefly described above, but I also think it would be a mistake to delude ourselves about the very significant state of uncertainty we are in.
So 70% of positive people are asymptomatic. So all the numbers are skewed to look worse than it is. Italy and UK France etc are only testing those who are symptomatic or show up at hospital. This is only 30%. It also says if you treat early no fatalities. China’s data is suspect this is robust 3000 patients.
Were 136 positives in a population of 3000 that is v v low around 3-4% so why are we calling to lockdown London force businesses into bankruptcy?
Thing is numbers are too small so either is a mild virus normally or it is not. We need more ,mass testing random population groups like South Korea and Italy have done. Rationing the tests while making decisions that affect us all is actually very poor science.
Looks increasingly like China has caused the West to wreck its economies for a virus that is less deadly than seasonal flu. https://www.theguardian.com/commentisfree/2020/mar/20/eradicated-coronavirus-mass-testing-covid-19-italy-vo
I’ve not managed to read the whole thing all through yet, skipped a bit to the conclusion. I will try and get through it all.
From what I have read, it doesn’t seem like you have fully considered the widespread testing of SK and Germany, and the source of those results.
In the UK, and almost certainly Italy, virtually every result will be someone who’s been hospitalised already. Which will naturally lead to a higher death to case rate, and also an older age skew.
In Germany and SK, they’re still in a process of track and trace, meaning a “truer” skew of ages, and probably morbidity. When I checked a day or so ago, if you look at Germany’s cases 14 days ago (5 days to reach hospitalisation, 9 days to death, on rough data), it matches quite well to a morbidity between 0.75% and 1%.
I wrote the first 2 paragraphs below 2 days ago, focusing on S Korea because they have the best statistics (large scale, relatively mature epidemic, testing ratio is 40:1 tests:positives, reliable government):
South Korea’s age distribution of confirmed cases effectively mirrors that of the general population–the only discrepancy being an excess of 20 somethings that equals/balances a shortage of under-20s. But, that discrepancy doesn’t matter for CFR estimates b/c the CFR for those under 30 is near zero. However, there is a 3:2 sex ratio favoring females, who have a CFR about 45% lower than males. Equalize the sex ratio and the current CFR in South Korea would be adjusted to 1.25%.
More importantly, what would happen if there were no new cases in S Korea? The current number of resolved cases is equal to the number of active cases 21 days ago. If all current active cases were resolved in the next 21 days, how many more deaths could we expect? Just looking at trends in daily deaths, it’s likely to be at least another 30. That would bring the adjusted CFR of 1.25% to at least 1.6%. I consider the range of 1.6-1.8% to be the best estimate of the CFR for a well-managed coronavirus outbreak. Given the massive testing they’ve done, there should be few asymptomatic cases missed by the testing. If the CFR for a poorly managed outbreak triples that number–and I think it would–we have a clear case against the herd immunity strategy. This is a situation in which it is clearly preferable to suppress social intercourse too much rather than too little.
As for Italy, their deaths seem to be under-counted according to reliable sources: https://globalnews.ca/news/6706748/coronavirus-deaths-italy-bergamo/
The mayor reports 400 deaths in Bergamo last week, when the year before 100 died that week. Yet, only 91 were confirmed for coronavirus.
Contra what Karl Davey says of German mortality, if you assume a 14 day period from diagnosis to death (which is reasonable if diagnosis is prompt), the current numbers are 1,463 diagnosed by 3-10 and 123 dead by 3-24. That equals 8.5% mortality. Of course, this is too high because diagnosis is often not prompt. The lag in mortality % seen in Germany mirrors what was seen in the early stages of S Korea’s outbreak; in S Korea mortality % has been rising for weeks.
Hi and thanks for an extremely thorough analysis, learnt a lot! But, some of the sentences crazy long, and make the text unecessarily hard to read!
Example:
Conversely, I have come across people, far less because optimism has fallen out of fashion in the past few days, who believe that it’s totally impossible that these policies could really explain why the number of deaths is not higher in those countries if the virus were really as dangerous as many estimates of the infection fatality rate and the proportion of cases requiring admission to ICU seem to indicate. For example, Eric Winsberg, a philosopher of science at the University of South Florida who has done a lot of work on simulations and recently published a book on philosophy and climate change, whom I want to thank in passing because the conversations I had with him about the epidemic helped me to avoid the groupthink I was just talking about, objected to me that although the restrictions on people’s freedom of movement put in place by the Chinese government were particularly radical, even the Chinese Communist Party could not have prevented a lot of people from violating the prohibitions.
But other than that, great read!!
Outstanding article, thanks very much. Found it eminently readable and comprehensible and, no, the sentences are NOT too long (for me,at least, and I’m neither a scientist nor a philosopher). I commend you on your mastery of English, which is orders of magnitude better than that of most native speakers. Particularly interesting was when you mention that “at the beginning of an epidemic, random factors probably play a big role”. You’re describing the sensitivity to initial conditions, i.e., The Butterfly Effect, which makes modelling all the more difficult. Stay healthy and bonne chance!